Bethlehem Area School District
| Bethlehem Area School District | |
|---|---|
|
| |
| Address | |
|
1516 Sycamore Street Bethlehem, Pennsylvania, Lehigh County, Northampton County 18017 United States of America | |
| Information | |
| Type | Public |
| School board | 9 locally elected members |
| Oversight |
SCHOOL BOARD: OFFICERS: Michael Faccinetto (President) Shannon Patrick (Vice President / Human Resource Chair) DIRECTORS: Basilio Bonilla, Jr. (Curriculum Chair) , Michele Cann (Facilities Chair) , Eugene McKeon (Finance Chair) , Craig Neiman , Rogelio Ortiz , Angela Sinkler , Sudantha Vidanage |
| Superintendent | Joseph J. Roy, Salary - $174,200 (2013-14) [1] (Contract July 1, 2014 to June 30, 2019)[2] |
| Administrator |
Dr Jack P Silva, Asst Superintendent, (contract November 1, 2014 to October 31, 2019) |
| Staff | 898 non teaching staff (2013) |
| Faculty |
928.80 teachers (2013)[3] |
| Grades | preschool-12 |
| Age | 4 years old preschool to 21 years old special education |
| Pupils |
13,681 pupils (2015)[4] |
| • Kindergarten | 874 (2014),[8] 1,022 (2005) |
| • Grade 1 | 916 (2014), 1,102 |
| • Grade 2 | 1,022 (2014), 1,050 |
| • Grade 3 | 972 (2014), 1,100 |
| • Grade 4 | 995 (2014), 1,062 |
| • Grade 5 | 1,041 (2014), 1,129 |
| • Grade 6 | 1,051 (2014), 1,156 |
| • Grade 7 | 1,032 (2014), 1,285 |
| • Grade 8 | 1,110 (2014), 1,229 |
| • Grade 9 | 1,259 (2014), 1,373 |
| • Grade 10 | 1,189 (2014), 1,248 |
| • Grade 11 | 1,120 (2014), 1,166 |
| • Grade 12 | 1,034 (2014), 1,062 (2005) |
| Language | English |
| Slogan | "Shaping the Future. One Child at a Time." |
| Budget |
$260 million (2016-17)[9] |
| Per pupil spending |
$11,508 (2008) |
| Website | http://www.beth.k12.pa.us/ |

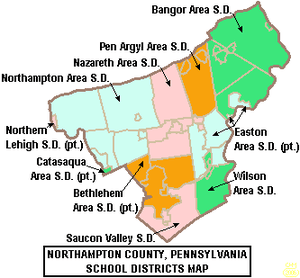
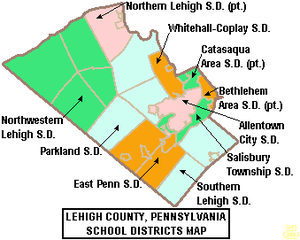
The Bethlehem Area School District covers the City of Bethlehem, the Boroughs of Fountain Hill and Freemansburg and Bethlehem Township and Hanover Township in Lehigh County and Northampton County. The district encompasses approximately 42.3 square miles (110 km2). According to 2000 federal census data, it served a resident population of 108,000. By 2010, the District's population increased to 116,968 people.[12] The educational attainment levels for the Bethlehem Area School District population (25 years old and over) were 87.9% high school graduates and 30.5% college graduates.[13] The District is one of the 500 public school districts of Pennsylvania.
According to the Pennsylvania Budget and Policy Center, 49.9% of the District’s pupils lived at 185% or below the Federal Poverty Level as shown by their eligibility for the federal free or reduced price school meal programs in 2012.[14] In 2013, the Pennsylvania Department of Education, reported that 285 students in the Bethlehem Area School District were homeless.[15]
In 2009, the district residents’ per capita income was $21,063, while the median family income was $52,732.[16] In the Commonwealth, the median family income was $49,501 [17] and the United States median family income was $49,445, in 2010.[18] In Northampton County, the median household income was $60,097.[19] By 2013, the median household income in the United States rose to $52,100.[20] In 2014, the median household income in the USA was $53,700.[21]
Bethlehem Area School District operates 22 schools: two high schools, four middle schools and sixteen elementary schools. High school students may choose to attend the Bethlehem Area Vocational-Technical School for training in the construction and mechanical trades. The Colonial Intermediate Unit IU20 provides the District with a wide variety of services like: specialized education for disabled students; state mandated training on recognizing and reporting child abuse; speech and visual disability services; criminal background check processing for prospective employees and professional development for staff and faculty.
The enrollment of the school district was 15,036 (2012), with 55% White, 9.5% Black, 32.3% Hispanic, 3.1% Asian, and 0.2% Native American.[22]
Schools
- High Schools
- Middle schools
- Broughal Middle School
- East Hills Middle School
- Nitschmann Middle School
- Northeast Middle School
- Elementary schools

- Asa Packer Elementary School
- Calypso Elementary School
- Clearview Elementary School
- Donegan Elementary School
- Farmersville Elementary School
- Fountain Hill Elementary School
- Fountain Hill Kindergarten Center
- Freemansburg Elementary School
- Governor Wolf Elementary School
- Hanover Elementary School
- James Buchanan Elementary School
- Lincoln Elementary School
- Marvine Elementary School
- Miller Heights Elementary School
- Spring Garden Elementary School
- Thomas Jefferson Elementary School
- William Penn Elementary School
Governance
Bethlehem Area School District is governed by 9 individually elected board members (serve without compensation for a term of four years), the Pennsylvania State Board of Education, the Pennsylvania Department of Education and the Pennsylvania General Assembly.[23] The federal government controls programs it funds like: Title I funding for low income children in the Elementary and Secondary Education Act and the No Child Left Behind Act(renamed Every Student Succeeds Act (ESSA) in December 2015) which mandates the district focus its resources on student success in acquiring reading and math skills.[24] The school board is required by state law to post a financial report on the district in its website by March of each school year.[25]
The Superintendent and Business Manager are appointed by the school board. The Superintendent is the chief administrative officer with overall responsibility for all aspects of operations, including education and finance. The Business Manager is responsible for budget and financial operations. Neither of these officials are voting members of the School Board. The School Board enters into individual employment contracts for these positions. These contracts must be in writing and are subject to public discloure under the state’s Right to Know Act. In Pennsylvania, public school districts are required to give 150 days notice to the Superintendent and Business Manager regarding renewal of their employment contracts.[26] Pursuant to Act 141 of 2012 which amended the Pennsylvania School Code, all school districts that have hired superintendents on/after the fall of 2012 are required to develop objective performance standards and post them on the district’s website.[27]
Academic achievement
In October 2015, Pennsylvania Auditor General Eugene DePasquale reported thatfive low performing schools in the District are among the 561 academically challenged schools that have been overlooked by the Pennsylvania Department of Education.[28][29] He also reported the Pennsylvania Department of Education failed to take any action to remediate the poorly performing schools to raise student academic achievement or to provide them with targeted professional assistance.[30] The BASD schools on the list were: Calypso Elementary School, Donegan Elementary School, Fountain Hill Elementary School, Freemansburg Elementary School and Broughal Middle School.
- Opportunity Scholarship - lowest achieving schools
In May 2015, the Pennsylvania Department of Education (PDE) released a report identifying seven Bethlehem Area School District schools as among the lowest achieving schools for reading and mathematics in the state.[31] Included on the list were: Marvine Elementary School, Lincoln Elementary School, Freemansburg Elementary School, Fountain Hill Elementary School, Broughal Middle School, Freedom High School and Liberty HIgh School. One hundred four (104) public school districts had one or more schools on the list.
In 2012, Calypso Elementary School, Fountain Hill Elementary School, Freemansburg Elementary School, William Penn Elementary School and Broughal Middle School were all among the 15% lowest achieving schools in the Commonwealth.[32] Parents and students may be eligible for scholarships to transfer to another public or nonpublic school through the state's Opportunity Scholarship Tax Credit Program passed in June 2012.[33] The scholarships are limited to those students whose family's income is less than $60,000 annually, with another $12,000 allowed per dependent. Maximum scholarship award is $8,500, with special education students receiving up to $15,000 for a year's tuition. Parents pay any difference between the scholarship amount and the receiving school's tuition rate. Students may seek admission to neighboring public school districts. Each year the PDE publishes the tuition rate for each individual public school district.[34] According to the report, parents in 414 public schools (74 school districts) were offered access to these scholarships. For the 2012-13 school year, nine public school districts in Pennsylvania had all of their schools placed on the list including: Steelton-Highspire School District, Sto-Rox School District, Chester Upland School District, Clairton City School District, Duquesne City School District, Farrell Area School District, Wilkinsburg Borough School District, and William Penn School District.[35] In 2014, Monessen City School District had all three of its schools added to the list. Funding for the scholarships comes from donations by businesses which receive a state business tax credit for donating.
- Statewide academic ranking
In 2015, Bethlehem Area School District's academic ranking declined further to 417th out of 493 Pennsylvania public school districts, by the Pittsburgh Business Times.[36] The ranking is based on the last 3 years of student academic achievement as demonstrated by PSSAs results in: reading, writing, math and science and the three Keystone Exams (literature, Algebra 1, Biology I) in high school.[37] Three school districts were excluded because they do not operate high schools (Saint Clair Area School District, Midland Borough School District, Duquesne City School District). The PSSAs are given to all children in grades 3rd through 8th. Adapted PSSA examinations are given to children in the special education programs. Writing exams were given to children in 5th and 8th grades.[38]
- 2014 - 410th[39]
- 2013 - 386th[40]
- 2012 - 370th[41]
- 2011 - 356th[42]
- 2010 - 342nd [43]
- 2009 - 351st
- 2008 - 353rd
- 2007 - 354th out of 501 Pennsylvania school districts ranking,[44]
- Overachievers Ranking
In 2011, the Pittsburgh Business Times reported an Overachievers Ranking for 497 Pennsylvania school districts. Bethlehem Area School District ranked 205th. The paper describes the ranking as: "a ranking answers the question - which school districts do better than expectations based upon economics? This rank takes the Honor Roll rank and adds the percentage of students in the district eligible for free and reduced-price lunch into the formula. A district finishing high on this rank is smashing expectations, and any district above the median point is exceeding expectations." [45]
- 2010 - 96th
- 2009 - 134th [46]
In 2009, Bethlehem Area School District student academic achievement ranked in the 21st percentile among 500 PA school districts. (0-99; 100 is state best)[47]
District AYP status history
In 2012, Bethlehem Area School District declined back to District Improvement I Adequate Yearly Progress (AYP) status, due to low graduation rate and chronic low academic achievement in reading and mathematics.[48] Fourteen schools did not achieve Adequate Yearly Progress status, with six schools in serious correction status.[49][50]
- 2011 - declined to Warning Adequate Yearly Progress (AYP) due to low academic achievement. In 2011, 94 percent of the 500 Pennsylvania public school districts achieved the No Child Left Behind Act progress level of 72% of students reading on grade level and 67% of students demonstrating on grade level math. In 2011, 46.9 percent of Pennsylvania school districts achieved Adequate Yearly Progress (AYP) based on student performance. An additional 37.8 percent of Pennsylvania public school districts made AYP based on a calculated method called safe harbor, 8.2 percent on the growth model and 0.8 percent on a two-year average performance.[51][52]
- 2009 and 2010 - achieved AYP status each year[53]
- 2008 - Making Progress District Corrective Action level 2 AYP status
- 2007 - declined further to Corrective Action 2 (first year) AYP status.[54]
- 2006 - declined to Corrective Action 1 AYP status
- 2005 - declined to School Improvement 2 AYP status
- 2004 - declined to School Improvement 1 AYP status due to lagging student academic achievement
- 2003 the District was in Warning status due to lagging student achievement.[55]
Graduation Rate
In 2015, Bethlehem Area School District graduation rate was 83%.[56]
- 2014 - 87.5%[57]
- 2013 - 87.6%[58]
- 2012 - 81.8%[59]
- 2011 - 83.5%
- 2010 - 82%, the Pennsylvania Department of Education issued a new, 4-year cohort graduation rate.[60]
- According to traditional graduation rate calculations
College remediation
According to a Pennsylvania Department of Education study released in January 2009, 25% of Bethlehem Area School District graduates required remediation in mathematics and or reading before they were prepared to take college level courses in the Pennsylvania State System of Higher Education or community colleges.[65][66] Less than 66% of Pennsylvania high school graduates, who enroll in a four-year college in Pennsylvania, will earn a bachelor's degree within six years.[67][68] Among Pennsylvania high school graduates pursuing an associate degree, only one in three graduate in three years.[69] Per the Pennsylvania Department of Education, one in three recent high school graduates who attend Pennsylvania's public universities and community colleges takes at least one remedial course in math, reading or English.
Broughal Middle School
Broughal Middle School is located at 114 West Morton Street, Bethlehem. In 2015, enrollment was 561 pupils, in grades 6th through 8th, with 89% of pupils eligible for a free lunch due to family poverty. Additionally, 29% of pupils received special education services, while 2% of pupils were identified as gifted.[70] According to a 2014 report by the Pennsylvania Department of Education, 99% of its teachers were rated "Highly Qualified" under No Child Left Behind.[71] The School was a federally designated Title I school.
According to the National Center for Education Statistics, in 2013, the school reported an enrollment of 539 pupils, in grades 6th through 8th, with pupils receiving a federal free or reduced price lunch due to family poverty. The school employed 48 teachers yielding a student-teacher ratio of 11:1.[72] According to a report by the Pennsylvania Department of Education, 15 teachers were rated "Non‐Highly Qualified" under No Child Left Behind.[73] The school was a federal designated Title I school.
- 2015 School Performance Profile
The PDE withheld SPP scores. It was reported that just 21% of 8th grade students at Broughal Middle School students were on grade level in reading on the PSSAs given in April 2015. In math/Algebra 1, only 10% of 8th grade students showed on grade level skills. In science, just 29% of the school’s 8th graders demonstrated on grade level science understanding. No eighth grade writing scores were reported. In the 7th grade, 23% were on grade level in reading, while only 5% showed on grade level math skills. Among 6th graders, 26% were on grade level in reading and 5% were on grade level in mathematics.[74] The school remains on the state's lowest achieving schools list where it has been included since 2012. Statewide 58% of eighth (8th) graders were on grade level in reading, while 29% demonstrated on grade level math skills. Pennsylvania 7th graders were 58% on grade level in reading and 33% demonstrated on grade level math skills. Among sixth (6th) graders, 60.7% were reading on grade level, while 39.7% demonstrated on grade level math skills. Statewide 61.9% of fifth (5th) graders were on grade level in reading, while 42.8% demonstrated on grade level math skills.[75]
- 2014 School Performance Profile
Broughal Middle School achieved a score of 53.6 out of 100. Reflects on grade level reading, mathematics and science achievement. In reading/literature, 50% of pupils were on grade level. In Algebra 1/Math, 49% of students showed on grade level mathematics skills. In Science, 27.9% of 8th graders showed on grade level science understanding. In writing, 41% of the 8th grade students demonstrated on grade level writing skills.[76] The school was on the state's lowest levels of academic achievement statewide list.[77] Under No Child Left Behind, the administration was required to notify parents that student could transfer to a better performing school within the District.[78]
- 2013 School Performance Profile
Broughal Middle School achieved 61.8 out of 100. Reflects on grade level reading, writing, mathematics and science achievement. In reading, just 47% of the students were on grade level. In Mathematics/Algebra 1, 54% of the students showed on grade level skills. In Science, only 28.7% of the 8th graders demonstrated on grade level understanding. In writing, 48.8% of the 8th grade students demonstrated on grade level writing skills.[79] According to the Pennsylvania Department of Education, 2,181 public schools (less than 73 percent of Pennsylvania public schools), achieved an academic score of 70 or higher. Broughal Middle School was listed on the state's lowest academic achievement statewide list.[80]
- AYP History
In 2012, Broughal Middle School declined further to Corrective Action I Adequate Yearly Progress (AYP) status, due to chronic low student academic achievement in reading and mathematics.[81]
- 2011 - declined to School Improvement II AYP status due to low academic achievement. Under No Child Left Behind, the administration was required to notify parents of the low achievement at the school.
- 2010 - remained in Making Progress School Improvement Level I AYP status[82][83]
- 2009 - declined to School Improvement Level I AYP status[84] The Pennsylvania Department of Education required the Administration to develop a School Improvement plan to raise student academic achievement in reading and mathematics. They were required to submit the plan for review. The District was required to provide after school tutoring at no cost to the pupils.
- 2008 - remained in Warning AYP status due to lagging academic achievement[85]
- 2007 - declined to Warning AYP status due to lagging academic achievement[86]
- 2003 to 2006 - achieved AYP status
- PSSA Results:
Pennsylvania System of School Assessments, commonly called PSSAs are NCLB related examination given in the Spring of each school year. Sixth and seventh grades have been tested in reading and mathematics since 2006. Eighth graders are tested in: reading, writing, mathematics and science. Beginning in the Spring of 2013, eighth graders, who are enrolled in Algebra I take the Keystone Exam for Algebra I at the end of the course. The testing of 8th grade in reading and mathematics began in 1999, as a state initiative.[87] Testing in science began in 2007. The goal is for 100% of students to be on grade level or better in reading and mathematics, by the Spring of 2014. The tests focus on the state's Academic Standards for reading, writing, mathematics and science.[88] The standards were published in 1998 and are mandated by the Pennsylvania State Board of Education.[89] In 2014, the Commonwealth of Pennsylvania adopted the Pennsylvania Core Standards - Mathematics.[90]
|
8th Grade Reading: |
8th Grade Math: |
8th Grade Science:
- 2012 - 24% on grade level (54 below basic). State - 59%[97]
- 2011 - 24% (52% below basic). State - 58.3%
- 2010 - 22% (54.8% below basic). State - 57%[98]
East Hills Middle School
East HIlls Middle School is located at 2005 Chester Road, Bethlehem. In 2015, enrollment was 1,075 pupils, in grades 6th through 8th, with 35% of pupils eligible for a free lunch due to family poverty. Additionally, 15% of pupils received special education services, while 7% of pupils were identified as gifted.[99] According to a 2014 report by the Pennsylvania Department of Education, 98% of its teachers were rated "Highly Qualified" under No Child Left Behind.[100][101]
According to the National Center for Education Statistics, in 2013, the school reported an enrollment of 1,090 pupils, in grades 6th through 8th, with 375 pupils receiving a federal free or reduced price lunch due to family poverty. The school employed 77 teachers yielding a student-teacher ratio of 14:1.[102] According to a report by the Pennsylvania Department of Education, 100% of the teachers were rated "Highly Qualified" under No Child Left Behind Act.[103]
- 2015 School Performance Profile
The PDE withheld SPP scores. It was reported that 65% of East Hills Middle School 8th grade students at East Hills Middle School students were on grade level in reading on the PSSAs given in April 2015. In math/Algebra 1, 23% of 8th grade students showed on grade level skills. In science, 59% of the school’s 8th graders demonstrated on grade level science understanding. No eighth grade writing scores were reported. In 7th grade, 61% were on grade level in reading, while 29% showed on grade level math skills. Among 6th graders, 55% were on grade level in reading and 28% were on grade level in mathematics.[104]
- 2014 School Performance Profile
East Hills Middle School achieved 76 out of 100. Reflects on grade level reading, mathematics and science achievement. In reading/literature - 74% were on grade level. In Algebra 1/Math, 70% showed on grade level mathematics skills. In Science, 60% of 8th graders showed on grade level science understanding. In writing, 82% of the 8th grade students demonstrated on grade level writing skills.[105]
- 2013 School Performance Profile
East Hills Middle School achieved 83.3 out of 100. Reflects on grade level reading, writing, mathematics and science achievement. In reading, just 74% of the students were on grade level. In Mathematics/Algebra 1, 74% of the students showed on grade level skills. In Science, 62.8% of the 8th graders demonstrated on grade level understanding. In writing, 78.8% of the 8th grade students demonstrated on grade level writing skills.[106]
- AYP History
In 2011 and 2012, East Hills Middle School was in Warning AYP status, due to lagging student achievement in reading and mathematics.[107]
- 2010 - achieved Adequate Yearly Progress (AYP)[108]
- 2009 - Making Progress - School Improvement Level 2[109]
- 2008 - declined to School Improvement Level 2 AYP due to low student academic achievement[110] The Pennsylvania Department of Education required the school to offer after school tutoring at no cost to the parents and to notify parents of the low achievement at the school.
- 2007 - Making Progress - School Improvement Level I AYP level[111]
- 2007 - declined to School Improvement Level I AYP level due to lagging academic achievement[112] The PDE required the school administration to develop a plan to raise student achievement and submit the plan for review.
Special education
In December 2015, Bethlehem Area School District administration reported that 2,430 pupils or 17.7% of the district's pupils received Special Education services, with 52.1% of the identified students having a specific learning disability.[113] In December 2012, the District administration reported that 2,235 pupils or 15.6% of the district's pupils received Special Education services, with 55.6% of the identified students having a specific learning disability. In December 2009, the District administration reported that 2,235 pupils or 14.5% of the district's pupils received Special Education services, with 56.5% of the identified students having a specific learning disability. Special education services in the Commonwealth are provided to students from ages three years to 21 years old. In the 2010-2011 school year, the total statewide student enrollment was more than 1.78 million students with approximately 275,000 students eligible for special education services. Among these students 18,959 were identified with mental retardation and 21,245 students with autism.[114] The largest group of students are identified as Specific Learning Disabilities 126,026 students (46.9 percent) and Speech or Language Impairments with 43,542 students (16.2 percent).[115]
In 2007, Pennsylvania Secretary of Education Gerald Zahorchak testified before the Pennsylvania House Education Committee regarding full day kindergarten. He claimed that districts which offered the program would see a significant decrease in special education students due to early identification and early intervention. He asserted the high cost of full day kindergarten would be recouped by Districts in lower special education costs.[116] Bethlehem Area School District has provided full day kindergarten and taxpayer funded preschool since 2003. The District has seen an increase in the percentage of special education students it serves, yielding no savings.
In order to comply with state and federal Individuals with Disabilities Education Act rules and regulations, the school district engages in identification procedures to ensure that eligible students receive an appropriate educational program consisting of special education and related services, individualized to meet student needs. At no cost to the parents, these services are provided in compliance with state and federal law; and are reasonably calculated to yield meaningful educational benefit and student progress.[117] To identify students who may be eligible for special education services, various screening activities are conducted on an ongoing basis. These screening activities include: review of group-based data (cumulative records, enrollment records, health records, report cards, ability and achievement test scores); hearing, vision, motor, and speech/language screening; and review by the Special Education administration. When screening results suggest that the student may be eligible, the District seeks parental consent to conduct a multidisciplinary evaluation. Parents who suspect their child is eligible may verbally request a multidisciplinary evaluation from a professional employee of the District or contact the district's Special Education Department. By Pennsylvania law, the District has 60 calendar days, after receiving parental consent, to complete the evaluation.[118][119][120] The IDEA 2004 requires each school entity to publish a notice to parents, in newspapers or other media, including the student handbook and website regarding the availability of screening and intervention services and how to access them.
Students who have an Individual Education Plan (IEP) may take the PSSA-M an alternative math exam rather than the PSSA.[121] Some special education students may take the PASA (Pennsylvania Alternate System of Assessment), rather than the PSSA.[122] Schools are permitted to provide accommodations to some students.[123]
In 2010, the state of Pennsylvania provided $1,026,815,000 for Special Education services. This funding was in addition to the state's basic education per pupil funding, as well as, all other state and federal funding.[124] The Special Education funding structure is through the federal Individuals with Disabilities Education Act (IDEA) funds and state appropriations. IDEA funds are appropriated to the state on an annual basis and distributed through intermediate units (IUs) to school districts, while state funds are distributed directly to the districts. Total funds that are received by school districts are calculated through a formula. The Pennsylvania Department of Education oversees four appropriations used to fund students with special needs: Special Education; Approved Private Schools; Pennsylvania Chartered Schools for the Deaf and Blind; and Early Intervention. The Pennsylvania Special Education funding system assumes that 16% of the district’s students receive special education services. It also assumes that each student’s needs accrue the same level of costs.[125] Over identification of students, in order to increase state funding, has been an issue in the Commonwealth. Some districts have more than 20% of its students receiving special education services while others have 10% supported through special education.[126] The state requires each public school district and charter school to have a three-year special education plan to meet the unique needs of its special education students.[127] In 2012, the Obama Administration's US Department of Education issued a directive requiring schools include students with disabilities in extracurricular activities, including sports.[128]
Bethlehem Area School District received a $6,584,843 state supplement for special education services in 2010.[129] For the 2011-12, 2012–13 and 2013-14 school years, all Pennsylvania public school districts received the same level of funding for special education that they received in 2010-11. This level funding was provided regardless of changes in the number of pupils who need special education services and regardless of the level of services the respective students required.[130][131]
- 2014-2015 school year, BASD received an increase to $6,718,809 from the Commonwealth for special education funding.[132]
- 2016-17 school year, Bethlehem Area School District received an increase in state special education funding to $7,131,879.[133]
Budget
Pennsylvania public school districts budget and expend funds according to procedures mandated by the General Assembly and the Pennsylvania Department of Education (PDE). An annual operating budget is prepared by school district administrative officials. A uniform form is furnished by the PDE and submitted to the board of school directors for approval prior to the beginning of each fiscal year on July 1.
Under Pennsylvania’s Taxpayer Relief Act, Act 1 of the Special Session of 2006, all school districts of the first class A, second class, third class and fourth class must adopt a preliminary budget proposal. The proposal must include estimated revenues and expenditures and the proposed tax rates. This proposed budget must be considered by the Board no later than 90 days prior to the date of the election immediately preceding the fiscal year. The preliminary budget proposal must also be printed and made available for public inspection at least 20 days prior to its adoption. The board of school directors may hold a public hearing on the budget, but are not required to do so. The board must give at least 10 days’ public notice of its intent to adopt the final budget according to Act 1 of 2006.[134]
In 2015, Bethlehem Area School Board entered into a new Teacher union contract for three years. It includes raises of 3.13 percent in 2015-16 and 2.99 percent in 2016-17. Additionally, starting salary for new teachers rises from $44,355 to $47,076 in 2015.[135] Teacher lso began to contribute to their health insurance for the first time. This means the District avoids a $4 million annual fine under the Patient Protection and Affordable Care Act's (Obamacare) "Cadillac plan" excise tax of 40%. Bethlehem Area was the last school district in the Lehigh Valley region to end providing full-coverage high-cost health insurance at no cost to the employee.
In 2013, the average teacher salary in Bethlehem Area School District was $67,614 a year.[136] The District employed 1,409 teachers with a top salary of $170,000.[137][138] Pennsylvania teacher salaries (2013–14) are searchable in a statewide database provided by TribLive News.[139] Bethlehem Area School District teacher and administrator retirement benefits are equal to at least 2.00% x Final Average Salary x Total Credited Service. (Some teachers benefits utilize a 2.50% benefit factor.)[140] After 40 years of service, Pennsylvania public school teachers and administrators can retire with 100% of the average salary of their final 3 years of employment. According to a study conducted at the American Enterprise Institute, in 2011, public school teachers’ total compensation is roughly 50 percent higher than they would likely receive in the private sector. The study found that the most generous benefits that teachers receive are not accounted for in many studies of compensation including: pension, retiree health benefits and job security.[141] In 2014-15, the state mandated District contribution to the teacher pension fund rose to 21.40% of employee salaries and in 2015-16 it rose again to 25.84% of total District salaries.[142]
In 2009, Bethlehem Area School District reported employing 1,172 teachers and administrators with a median salary of $59,957 and a top salary of 133,656.[143] The teacher’s work day was 7.5 hours, with 190 days in the contract year. Additionally, the teachers receive a defined benefit state pension, health insurance, professional development reimbursement, 2 paid personal days, 2 paid emergency days, 10 paid sick days, paid death days for extended family members, 2/3rd pay sabbatical leave and other benefits.[144]
- Administration costs
Bethlehem Area School District administrative costs per pupil in 2008 was $659.26 per pupil. The lowest administrative cost per pupil in Pennsylvania was $398 per pupil.[145] The Pennsylvania School Boards Association collects and maintains statistics on salaries of public school district employees in Pennsylvania.[146] According to the association's report, the average salary for a superintendent, for the 2007-08 school year, was $122,165. Superintendents and administrators receive a benefit package commensurate with that offered to the district's teachers' union.[147][148]
- Tuition
Students who live in the Bethlehem Area School District's attendance area may choose to attend one of Pennsylvania's 157 public charter schools. A student living in a neighboring public school district or a foreign exchange student may seek admission to Area School District. For these cases, the Pennsylvania Department of Education sets an annual tuition rate for each school district. It is the amount the public school district pays to a charter school for each resident student that attends the charter and it is the amount a nonresident student's parents must pay to attend the District's schools. The 2015 tuition rates for Bethlehem Area School District were elementary schools - $10,769, high schools - $10,401.[149]
Bethleham Area School District is funded by a combination of: a local earned income tax 1%,[150] a property tax, Local Services Tax - $10, per capita tax - $5, a real estate transfer tax 0.5%, Mercantile Tax 1.5%, coupled with substantial funding from the Commonwealth of Pennsylvania and a small amount, generally 10% of its budget from the federal government.[151] Grants can provide an opportunity to supplement school funding without raising local taxes. Interest earnings on accounts also provide nontax income to the District. In the Commonwealth of Pennsylvania, pension income and Social Security income are exempted from state personal income tax and local earned income tax, regardless of the level of the individual’s personal wealth.[152] The average Pennsylvania public school teacher pension in 2011 exceeded $60,000 a year, plus they receive federal Social Security benefits. Both retirement benefits are free of Pennsylvania state income tax and local income tax which funds local public schools.[153] Effective 2016, active duty military are also exempted from paying the local earned income tax in Pennsylvania.[154][155]
State basic education funding
According to a report from Representative Todd Stephens office, Bethlehem Area School District receives 25.7% of its annual revenue from the state.[156] This exceeds some education advocates goal of the state providing 50% of district funding.[157]
In December 2014, the Pennsylvania Education Funding Reform Commission conducted a hearing.[158][159] The commission developed a new basic education funding formula which sets a new way to distribute state basic education dollars. It abolished the practice of "hold harmless" funding, which gave districts at least the same as they got the previous school year regardless of declining enrollment. The plan became law in June 2016 (House Bill 1552).[160][161][162]
For the 2016-17 school year, Bethlehem Area School District received $30,913,343 in Basic Education Funding from the Commonwealth of Pennsylvania. This is a 5.8% increase over 2015-16 funding o the District. The highest percentage of BEF increase in Northampton County was awarded to Bethlehem Area School District under the state’s Basic Education Funding formula. For the 2016-17 school year, Pennsylvania increased its public education spending to a record high of $5,895 billion. It was a $200 million increase, 3.51% increase over the 2015-16 appropriation.[163] The state also funded Ready to Learn grants at $250 million and Special Education funding received a $20 million increase.[164] The state also paid $492 million to the school employee social security fund and another $2.064 billion to the teacher’s pension fund.[165]
For the 2015-16 school year, Governor Tom Wolf released a partial Basic Education Funding of $15,039,123 to Bethlehem Area School District, in January 2016.[166] This was part of $10.3 billion in school funding withheld from the public schools, by the Governor since the summer of 2015.[167] The dispersement did not follow the new Basic Education Fair Funding formula which had been established by the Pennsylvania General Assemby in June 2015.[168] Ten (10) Pennsylvania school districts received no increase in Basic Eductaion funding under Governor Wolf.[169][170]
In compliance with a legislative mandate that was passed with veto proof majorities in the Pennsylvania House and Senate,[171] the final BEF funding was determined for 2015-16, in April 2016. Bethlehem Area School District received $29,220,357 in Basic Education Funds for the 2015-16 school year. This was a 4.63% increase yielding a $1,292,390 increase over the previous school year funding. The District also received $1,797,733 in Ready to Learn funding from the state.[172]
For the 2014-15 school year, Bethlehem Area School District received $27,927,968 in State Basic Education funding. The District received $1,399,034 in new Ready To Learn Block grant. The State’s enacted Education Budget included $5,526,129,000 for the 2014-2015 Basic Education Funding.[173] The Education budget also included Accountability Block Grant funding at $100 million and $241 million in new Ready to Learn funding for public schools that focus on student achievement and academic success. The State paid $500.8 million to Social Security on the school employees behalf and another $1.16 billion to the state teachers pension system (PSERS). In total, Pennsylvania’s Education budget for K-12 public schools is $10 billion. This was a $305 million increase over 2013-14 state spending and the greatest amount ever allotted by the Commonwealth for its public schools.[174]
In the 2013-14 school year, Bethlehem Area School District received a 2.8% increase or $27,803,331 in Pennsylvania Basic Education Funding. This is $758,711 more than its 2012-13 state BEF to the District. Additionally, Bethlehem Area School District received $665,439 in Accountability Block Grant funding to focus on academic achievement and level funding for special education services. Among the public school districts in Northampton County, BASD and Easton Area School District received the highest percentage increase in BEF at 2.8%. The District had the option of applying for several other state and federal grants to increase revenues. The Commonwealth’s budget increased Basic Education Funding statewide by $123 million to over $5.5 billion. Most of Pennsylvania’s 500 public school districts received an increase of Basic Education Funding in a range of 0.9% to 4%. Eight public school districts received exceptionally high funding increases of 10% to 16%. The highest increase in state funding was awarded to Austin Area School District which received a 22.5% increase in Basic Education Funding.[175] The highest percent of state spending per student was in the Chester-Upland School District, where roughly 78 percent comes from state coffers. In Philadelphia, it was nearly 49 percent.[176] As a part of the education budget, the state provided the PSERS (Pennsylvania school employee pension fund) with $1,017,000,000 and Social Security payments for school employees of $495 million.[177]
For the 2012-13 school year, Bethlehem Area School District received $27,044,620 in state basic education funding.[178] The Governor's Executive Budget for 2012-2013 included $9.34 billion for kindergarten through 12th grade public education, including $5.4 billion in basic education funding, which was an increase of $49 million over the 2011-12 budget. In addition, the Commonwealth provided $100 million for the Accountability Block Grant (ABG) program. Bethlehem Area received $665,439 in ABG funds. The state also provided a $544.4 million payment for School Employees’ Social Security and $856 million for School Employees’ Retirement fund called PSERS.[179] This amount was a $21,823,000 increase (0.34%) over the 2011-2012 appropriations for Basic Education Funding, School Employees' Social Security, Pupil Transportation, Nonpublic and Charter School Pupil Transportation. Since taking office, Corbett’s first two budgets have restored more than $918 million in support of public schools, compensating for the $1 billion in federal stimulus dollars lost at the end of the 2010-11 school year.
Real estate taxes
Property tax rates in 2015-16 were set by the Bethlehem Area School Board at 16.2300 mills for Lehigh County property owners and 52.5100 mills for Northampton County property owners.[180] A mill is $1 of tax for every $1,000 of a property's assessed value. Irregular property reassessments have become a serious issue in the commonwealth as it creates a significant disparity in taxation within a community and across a region.[181] Property taxes, in the Commonwealth of Pennsylvania, apply only to real estate - land and buildings. The property tax is not levied on cars, business inventory, or other personal property. Certain types of property are exempt from property taxes, including: places of worship, places of burial, private social clubs, charitable and educational institutions and all government property (local, state and federal). Additionally, service related, disabled US military veterans may seek an exemption from paying property taxes. Unlike other states, under Pennsylvania state tax policy, natural gas and oil pipelines are exempted from property taxes.[182]
Pennsylvania school district revenues are dominated by two main sources: 1) Property tax collections, which account for the vast majority (between 75-85%) of local revenues; and 2) Act 511 tax collections, which are around 15% of revenues for school districts.[183] When a Pennsylvania public school district includes municipalities in two or more counties, like Bethlehem Area does, each of which has different rates of property tax assessment, a state board equalizes the tax rates between the counties.[184] In 2010, miscalculations by the State Tax Equalization Board (STEB) were widespread in the Commonwealth and adversely impacted funding for many school districts, including those that did not cross county borders.[185]
- 2014-15 - Lehigh County 15.7700 mills, Northampton County - 50.9900 mills[186]
- 2013-14 - Lehigh County 15.4100 mills, Northampton County 48.3600 mills[187]
- 2012-13 - Lehigh County 47.0900 mills, Northampton County 47.0900 mills [188]
- 2011-12 - Lehigh County 44.9200 mills, Northampton County 44.9200 mills.[189]
- 2010-11 - Lehigh County 44.1700 mills, Northampton County 44.1700 mills [190]
- 2009-10 - Lehigh County 41.6000 mills, Northampton County 41.6000 mills.[191]
- 2008-09 - Lehigh County 39.5800 mills, Northampton County 39.5800 mills.[192]
- 2007-08 - Lehigh County 37.5600 mills, Northampton County 37.5600 mills.[193]
- 2006-07 - Lehigh County 36.5800 mills, Northampton County 36.5800 mills.[194]
- 2005-06 - Lehigh County 35.5800 mills, Northampton County 35.5800 mills.[195]
Lehigh County has one of the highest property taxes in the USA in 2015.[196] The average yearly property tax paid by Lehigh County residents amounts to about 4.39% of their yearly income. Lehigh County ranked 149th out of the 3143 United States counties for property taxes as a percentage of median income.[197] According to a report prepared by the Pennsylvania Department of Education, the total real estate taxes collected by all school districts in Pennsylvania rose from $6,474,133,936 in 1999-00 to $10,438,463,356 in 2008-09 and to $11,153,412,490 in 2011.[198] Property taxes in Pennsylvania are relatively high on a national scale. According to the Tax Foundation, Pennsylvania ranked 11th in the U.S. in 2008 in terms of property taxes paid as a percentage of home value (1.34%) and 12th in the country in terms of property taxes as a percentage of income (3.55%).[199] Pennsylvania's 2011 tax burden of 10.35% ranked 10th highest out of 50 states. The tax burden was above the national average of 9.8%. Pennsylvania's taxpayers paid $4,374 per capita in state and local taxes, including school taxes.[200]
Private/Other Schools
- Bethlehem Catholic High School
- Centennial School
- Holy Infancy Elementary School
- Lehigh Valley Academy
- Moravian Academy
- Notre Dame of Bethlehem Elementary School
- Our Lady of Perpetual Help School
- Regional Academic Standards Academy
- St. Anne Elementary School
References
- ↑ Tribune Live.com (2015). "PA Teacher Salaries Database".
- ↑ PDE, ED Names and Addresses, 2016
- ↑ National Center for Education Statistics (2016). "Common Core of Data - Bethlehem Area School District 2013-14".
- ↑ Pennsylvania Department of Education (December 4, 2015). "Bethlehem Area School District Fast Facts 2015".
- ↑ PDE, Enrollment by LEA and Schol 2012-13, 2013
- ↑ PDE, Enrollment by LEA and Schol 2010-11, 2010
- ↑ PDE, Enrollment by LEA 2004-05, 2005
- ↑ PDE, Enrollment by LEA 2014-15, 2015
- ↑ Daryl Nerl, (June 14, 2016). "Some relief for taxpayers in final Bethlehem Area School District budget". The Morning Call.
- ↑ Amy Herzog (June 26, 2014). "BASD: Board passes budget that includes 5 % tax increase". The Morning Call.
- ↑ Steve Esack., Bethlehem Area board mulls killing $25 student activity fee, The Morning Call, July 11, 2011
- ↑ US Census Bureau, 2010 Census Poverty Data by Local Education Agency, 2011
- ↑ proximityone (2014). "School District Comparative Analysis Profiles".
- ↑ Pennsylvania Budget and Policy Center, Education Facts Student Poverty Concentration by LEA, 2012
- ↑ Collin Deppen (January 2015). "How many children are homeless in your school district?" (PDF). Pennsylvania Department of Education.
- ↑ US Census Bureau, American Fact Finder, 2009
- ↑ US Census Bureau (2010). "American Fact Finder, State and County quick facts".
- ↑ US Census Bureau (September 2011). "Income, Poverty, and Health Insurance Coverage in the United States: 2010" (PDF).
- ↑ US Census Bureau (2014). "Pennsylvania Median household income, 2006-2010 by County".
- ↑ Michael Sauter & Alexander E.M. Hess, (August 31, 2013). "America's most popular six-figure jobs". USA Today.
- ↑ Jeff Guo (September 15, 2015). "Lower wages for whites, higher wages for immigrants, and inequality for all". Washington Post.
- ↑ http://www.publicschoolreview.com/agency_schools/leaid/4203570
- ↑ Pennsylvania Public School Code Governance 2010
- ↑ US Department of Education (2015). "Every Student Succeeds Act".
- ↑ Pennsylvania General Assembly (2012). "Act of Jul. 12, 2012, P.L. 1142, No. 141 Section 921-A".
- ↑ Pennsylvania General Assembly, Pennsylvania School Code, 2013
- ↑ Pennsylvania General Assembly (2012). "Act of Jul. 12, 2012, P.L. 1142, No. 141".
- ↑ Pennsylvania Auditor General Office (October 6, 2015). "561 Academically Challenged Schools Overlooked by the Department of Education" (PDF). Archived from the original (PDF) on 2015-11-18.
- ↑ Joe Sylvester (October 7, 2015). "8 schools in Valley jilted, audit reveals". The Daily Item.
- ↑ Pennsylvania Auditor General Office (October 7, 2015). "Special Performance Audit Report - Pennsylvania Department of Education" (PDF).
- ↑ Pennsylvania Department of Education (May 11, 2015). "Opportunity Scholarship Tax Credit Program".
- ↑ Marion Callahan; Steve Esack, (July 26, 2012). "Allentown, Bethlehem schools make state's low-achievers list". The Morning Call.
- ↑ Pennsylvania Department of Community and Economic Development (April 2014). "Opportunity Scholarship Tax Credit Program FAQ".
- ↑ Pennsylvania Department of Education (May 2015). "Tuition rate Fiscal Year 2014-2015".
- ↑ Olsen, Laura, State list of failing schools has 53 in county, Pittsburgh Post Gazette, July 26, 2012
- ↑ Pittsburgh Business Times (April 10, 2015). "Guide to Pennsylvania Schools Statewide School District Ranking 2015".
- ↑ Pittsburgh Business Times (April 11, 2014). "What makes up a district's School Performance Profile score?".
- ↑ Paul Jablow (November 18, 2015). "Understanding the PSSA exams". The Notebook.
- ↑ Pittsburgh Business Times (April 11, 2014). "Western Pennsylvania School Guide 2014".
- ↑ "Statewide Honor Roll Rankings 2013". Pittsburgh Business Times. April 5, 2013.
- ↑ Pittsburgh Business Times, Statewide Honor Roll Rankings 2012, April 4, 2012
- ↑ Pittsburgh Business Times (April 2011). "Statewide Honor Roll Rankings 2011". Archived from the original on 2011-07-23.
- ↑ Pittsburgh Business Times (May 2010). "Statewide Honor Roll Rankings,".
- ↑ "Three of top school districts in state hail from Allegheny County". Pittsburgh Business Times. May 2007.
- ↑ "Overachiever statewide ranking,". Pittsburgh Business Times. April 2011. Archived from the original on 2011-07-23.
- ↑ "Overachiever's Ranking 2010". Pittsburgh Business Times. April 30, 2010.
- ↑ "2009 PSSA RESULTS Bethlehem Area School District,". The Morning Call. 2009.
- ↑ Pennsylvania Department of Education (September 21, 2012). "Bethlehem Area School District AYP Overview 2012".
- ↑ Pennsylvania Department of Education (September 21, 2012). "Bethlehem Area School District AYP status schools 2012".
- ↑ Sara K. Satullo (September 2, 2012). "Bethlehem Area School District has 14 schools that fail to meet state test standards". lehighvalleylive.com.
- ↑ Pennsylvania Department of Education (September 21, 2012). "About Adequate Yearly Progress (AYP) in Pennsylvania".
- ↑ Pennsylvania Department of Education, Pennsylvania Public School District AYP History, 2011
- ↑ Pennsylvania Department of Education, Bethlehem Area School District AYP Overview 2010, October 2010
- ↑ Pennsylvania Department of Education, Bethlehem Area School District AYP Overview 2007, 2007
- ↑ Pennsylvania Department of Education, Pennsylvania District AYP History 2003-2011, 2011
- ↑ PDE, Bethlehem Area School District Fast Facts 2015, 2015
- ↑ PDE, Bethlehem Area School District Fast Facts 2014, 2014
- ↑ PDE, Bethlehem Area School District Fast Facts 2013, 2013
- ↑ Pennsylvania Department of Education (September 21, 2012). "Bethlehem Area School District AYP Overview 2012".
- ↑ Pennsylvania Department of Education (March 15, 2011). "New 4-year Cohort Graduation Rate Calculation Now Being Implemented".
- ↑ Pennsylvania Department of Education, Bethlehem Area School District Academic Achievement Report Card 2010, October 20, 2010
- ↑ Pennsylvania Department of Education, Bethlehem Area School District District AYP Data Table 2009, September 14, 2009
- ↑ The Times-Tribune (June 25, 2009). "Bethlehem Area School District".
- ↑ Pennsylvania Partnership for children (2007). "PA High School Graduation Info by School District 2007" (PDF).
- ↑ Jan Murphy (January 30, 2009). "Report: One-third of local high schoolers unprepared for college". Pennlive.com.
- ↑ Pennsylvania Department of Education (January 20, 2009). "Pennsylvania College Remediation Report 2009".
- ↑ National Center for Education Statistics, IPEDS Integrated Postsecondary Education Data System, 2008
- ↑ Achieve.org (2014). "THE VALUE OF THE COLLEGE- AND CAREER-READY AGENDA IN PENNSYLVANIA" (PDF).
- ↑ National Center for Education Statistics
- ↑ Pennsylvania Department of Education (November 4, 2015). "Broughal Middle School Fast Facts 2015".
- ↑ Pennsylvania Department of Education, Professional Qualifications of Teachers Broughal Middle School, November 5, 2015
- ↑ National Center for Education Statistics, Common Core Data – Broughal Middle School, 2012
- ↑ Pennsylvania Department of Education, Professional Qualifications of Teachers Broughal Middle School, September 21, 2012
- ↑ Pennsylvania Department of Education (October 1, 2015). "2015 PSSA School Level Data".
- ↑ Pennsylvania Department of Education (October 1, 2015). "2015 PSSA State Level Data".
- ↑ Pennsylvania Department of Education (November 6, 2014). "Broughal Middle School Academic Performance Data 2014".
- ↑ PDE, Opportunity Scholarship List 2013-14, May 2013
- ↑ US Department of Education, No Child Left Behind Accountability Guidelines, 2003
- ↑ PDE, Broughal Middle School Academic Performance Data 2013, October 4, 2013
- ↑ PDE, Opportunity Scholarship List 2012-13, May 2012
- ↑ Pennsylvania Department of Education (September 21, 2012). "Broughal Middle School AYP Overview 2012".
- ↑ Pennsylvania Department of Education, Broughal Middle School AYP Overview 2010, October 20, 2010
- ↑ PDE (2010). "2003-2010 School AYP Status" (PDF).
- ↑ Pennsylvania Department of Education, Broughal Middle School AYP Overview 2009, September 14, 2009
- ↑ Pennsylvania Department of Education, Broughal Middle School AYP Overview 2008, August 2008
- ↑ Pennsylvania Department of Education, Broughal Middle School AYP Overview 2007, 2007
- ↑ Pennsylvania Department of Education. "IU16-PSSA 95-96 Results by School". Retrieved May 11, 2014.
- ↑ Pennsylvania Department of Education (2014). "Standards Aligned Systems".
- ↑ Pennsylvania Department of Education (2014). "State Academic Standards".
- ↑ Pennsylvania Department of Education (2014). "State Academic Standards Mathematics".
- ↑ Pittsburgh Post Gazette (October 15, 2012). "How is your school doing?".
- ↑ The Times-Tribune (2011). "Grading Our Schools database, 2010-11 Reading PSSA results".
- ↑ Pennsylvania Department of Education, Broughal Middle School Academic Achievement Report Card 2010, October 20, 2010
- ↑ Pennsylvania Department of Education (September 21, 2012). "Broughal Middle School Academic Achievement Report Card 2012" (PDF).
- ↑ Pennsylvania Department of Education, Broughal Middle School Academic Achievement Report Card 2011, September 29, 2011
- ↑ The Times-Tribune (2010). "Grading Our Schools database, 2009-10 PSSA results".
- ↑ The Times-Tribune (2012). "Grading Our Schools database, 2011-12 Science PSSA results".
- ↑ Pennsylvania Department of Education Report (August 2010). "Science PSSA 2010 by Schools".
- ↑ Pennsylvania Department of Education (November 4, 2015). "East Hills Middle School Fast Facts 2015".
- ↑ Pennsylvania Department of Education, Professional Qualifications of Teachers Middle School, November 5, 2015
- ↑ Pennsylvania Department of Education (September 21, 2012). "East Hills Middle School Academic Achievement Report Card 2012" (PDF).
- ↑ National Center for Education Statistics, Common Core Data – East Hills Middle School, 2012
- ↑ Pennsylvania Department of Education, Professional Qualifications of Teachers Middle School, September 21, 2012
- ↑ Pennsylvania Department of Education (October 1, 2015). "2015 PSSA School Level Data".
- ↑ Pennsylvania Department of Education (November 6, 2014). "East Hills Middle School Academic Performance Data 2014".
- ↑ PDE, East Hills Middle School Academic Performance Data 2013, October 4, 2013
- ↑ Pennsylvania Department of Education (September 21, 2012). "East Hills Middle School AYP Overview 2012".
- ↑ PDE, East Hills Middle School AYP Overview 2010, October 20, 2010
- ↑ PDE, East Hills Middle School AYP Overview 2009, September 14, 2009
- ↑ PDE, East Hills Middle School AYP Overview 2008, August 15, 2008
- ↑ PDE, East Hills Middle School AYP Overview 2007, 2007
- ↑ PDE, East Hills Middle School AYP Overview 2006, 2006
- ↑ Pennsylvania Bureau of Special Education Services (2015). "Bethlehem Area School District Special Education Data Report LEA Performance on State Performance Plan (SPP) Targets".
- ↑ Pennsylvania Department of Education, Testimony Hearing on Special Education Senate Republican Policy Committee, January 2013
- ↑ Pennsylvania Department of Education (2016). "PA Special Education".
- ↑ Gerald L. Zahorchak, D. Ed. (May 30, 2007). "House Education Committee Hearing on Governor's Proposed Increase for Accountability Block Grants Testimony for Gerald L. Zahorchak, D. Ed. Secretary, Pennsylvania Department of Education" (PDF).
- ↑ Pennsylvania Bureau of Special Education (2008). "Pennsylvania Parent Guide to Special Education Services" (PDF).
- ↑ Education Law Center (2012). "Key Timelines in the School-Age Special Education System" (PDF).
- ↑ Pennsylvania Department of Education - School District Administration (January 6, 2011). "Procedural Safeguards Notice".
- ↑ Pennsylvania Department of Education, Bureau of Special Education (September 2005). "Gaskin Settlement Agreement Overview Facts Sheet" (PDF).
- ↑ Eleanor Chute., Modified PSSA test in math offered for 1st time, Pittsburgh Post-Gazette, April 18, 2010
- ↑ "PSSA and Keystone Exam Accommodation Guidelines for Students with IEPs and 504 Plans". 2015. Archived from the original on 2015-10-25.
- ↑ Pennsylvania Department of Education (December 12, 2014). "PSSA/ Keystone Accommodations Guidelines (PDE) 2015".
- ↑ Pennsylvania Department of Education, Pennsylvania Special Education Funding, 2010
- ↑ Browne, Patrick., Senate Education Committee Hearing on Special Education Funding & Accountability testimony, November 1, 2011
- ↑ Kintisch, Baruch (November 11, 2011). "Public Hearing: Pennsylvania Special Education Funding & Accountability Testimony".
- ↑ Amy Morton, Executive Deputy Secretary, Public Hearing: Special Education Funding & Accountability Testimony, Pennsylvania Department of Education, November 11, 2011
- ↑ US Department of Education (January 25, 2013). "U.S. Department of Education Clarifies Schools' Obligation to Provide Equal Opportunity to Students with Disabilities to Participate in Extracurricular Athletics".
- ↑ Pennsylvania Department of Education, Special Education Funding from Pennsylvania State_2010-2011, July 2010
- ↑ Pennsylvania Department of Education, Special Education Funding 2011-2012 Fiscal Year, 2011
- ↑ Pennsylvania Department of Education, Investing in PA kids, April 2012
- ↑ Pennsylvania Department of Education, Special Education funding report by LEA, July 2014
- ↑ Pennsylvania Department of Education, BEF, Special Education Funding, RTL Grants 2016-17, July 2016
- ↑ Pennsylvania General Assembly, Taxpayer Relief Act, Act 1 of the Special Session of 2006, June 27, 2006
- ↑ By Sara K. Satullo., Bethlehem Area School District teachers, board compromise on latest pact, Lehighvalleylive.com, March 17, 2015
- ↑ Pennsylvania Department of Education, Investing in Pennsylvania Students, 2013
- ↑ "Bethlehem Area School District Payroll report 2013". OpenPA Gov.org. 2014. Archived from the original on 2010-11-19.
- ↑ Times Tribune (June 16, 2013). "PA Teacher Profile Database 2011-12".
- ↑ Triblive News (2015). "Pennsylvania teacher salary search".
- ↑ Pennsylvania School Employees Retirement System (2014). "Your PSERS Benefits & Leaving Employment".
- ↑ American Enterprise Institute, (2011). "Assessing the Compensation of Public School Teachers". Archived from the original on 2013-01-03.
- ↑ PSERS Board of Trustees (2015). "Fiscal Year 2015/2016 Employer Contribution Rate" (PDF).
- ↑ Asbury Park Press (2009). "PA. Public School Salaries".
- ↑ Bethlehem Area School Board (2010). "Bethlehem Area School District Teacher Union Employment Contract 2010". Archived from the original on 2010-11-19.
- ↑ Fenton, Jacob., Pennsylvania School District Data: Will School Consolidation Save Money?, The Morning Call, February 2009
- ↑ Pennsylvania School Board Association (2015). "Salaries, Five-Year Review of Average Annual Salaries (2014)".
- ↑ Pennsylvania School Board Association (October 2009). "Public School Salaries 11th Annual". Archived from the original on 2008-10-05.
- ↑ Pennsylvania School Board Association (June 22, 2012). "School Management Salaries Report". School Leader News. Archived from the original on 2013-09-21.
- ↑ Pennsylvania Department of Education (May 2015). "Pennsylvania Public School District Tuition Rates For Use During the 2014-2015 Fiscal Year".
- ↑ Pennsylvania of Community and Economic Development (2012). "Earned Income Tax".
- ↑ Penn State Cooperative Extension (2010). "What are the Local Taxes in Pennsylvania?, Local Tax Reform Education Project" (PDF).
- ↑ Pennsylvania Department of Revenue (April 2010). "Personal Income Taxation Guidelines".
- ↑ John Finnerty (2013). "PA teachers pensions". CNHI Harrisburg Bureau.
- ↑ Herald-Mail Media (February 24, 2016). "Kauffman law exempts military pay from Pa. earned-income taxes".
- ↑ Myle Snyder (February 23, 2016). "Gov. Wolf signs bill to exempt active duty military pay from local tax". ABC27 News.
- ↑ Pennsylvania Representative Todd Stephens (January 23, 2014). "LEEF Funding Chart 2014".
- ↑ JANICE BISSETT & ARNOLD HILLMAN (2006). "A Summary of the History and Financing of Education in Pennsylvania 1682- 2013" (PDF). PA Association of Rural and Small Schools.
- ↑ Nathan Benefield and James Paul Senior Policy Analyst (December 3, 2014). "School Funding Reform & Weighted Student Funding" (PDF).
- ↑ Pennsylvania General Assembly - Education Reform Commission (December 2014). "Basic Education Funding Commission Public Hearing Funding Issues related to Enrollment and Growth".
- ↑ Basic Education Funding Commission, Commission minutes, 2016
- ↑ York Dispatch, Governor Wolf Signs Fair Funding Formula, June 2016
- ↑ Pennsylvania General Assembly (June 2016). "House Bill 1552, Act 35 of 2016".
- ↑ Pennsylvania Department of Eductaion, Education Budget 2016-17, July 2016
- ↑ PDE, Special Education Funding fiscal year 2016-17, July 2017
- ↑ PA Office of Budget, Commonwealth 2016-17 Enacted Budget Line-Item Appropriations, July 2016
- ↑ Jan Murphey (January 4, 2016). "Here's the payout your school district gets from the partial 2015-16 state budget". Pennlive.com.
- ↑ Jennifer Wakeman (January 4, 2016). "Harrisburg releases $3.3 billion in delayed funds".
- ↑ Pennsylvania General Assembly (June 26, 2015). "Basic Education Funding Commission".
- ↑ Jan Murphy (January 6, 2016). "School funding distribution gives rise to new battle between Wolf, GOP lawmakers". PennLive.com.
- ↑ Pennsylvania Department of Education (January 2016). "Summary of State Appropriations for Education 2015-2016 Fiscal Year Education Budget". Archived from the original on 2016-01-28.
- ↑ Jan Murphy (April 15, 2016). "House, Senate cast veto-proof majority votes on school funding bill". Pennlive.com.
- ↑ PDE, Ed Budget 2015-16 , May 2016
- ↑ PDE (July 7, 2014). "Enacted Education Budget 2014-2015".
- ↑ Pennsylvania Department of Education, 2014-15 Enacted Education Budget Fast Facts, July 14, 2014
- ↑ Democrat Appropriations Committee, Report on Education funding by LEA, July 2, 2013
- ↑ Sam Wood and Brian X. McCrone (January 29, 2014). "Montgomery County lawmaker proposes using Pa. horse racing funds for education". Philadelphia Inquirer.
- ↑ Pennsylvania Office of the Budget, 2013-14 State Budget Highlights, 2013
- ↑ Senator Jake Corman (June 28, 2012). "Pennsylvania Education funding by Local School District" (PDF). Archived from the original (PDF) on 2012-07-30.
- ↑ Pennsylvania General Assembly Sen Jake Corman (June 29, 2012). "SB1466 of 2012 General Fund Appropriation".
- ↑ PDE (October 2015). "Finances RE Tax Rates 2014-15".
- ↑ Pennsylvania Department of Education (2012). "Real Estate Tax Rates by School District 2012-13 Real Estate Mills".
- ↑ Katie Colaneri (June 11, 2015). "New pipeline could mean tax bonanza for NJ towns, but for Pa.? Not so much". State Impact NPR.org.
- ↑ Pennsylvania Department of Education (2004). "Act 511 Tax Report".
- ↑ State Tax Equalization Board (2011). "State Tax Equalization Board About US". Archived from the original on 2012-11-14.
- ↑ Pennsylvania Auditor General office - Bureau of Audits (February 2011). "A Special Performance Audit of the Pennsylvania State Tax Equalization Boards" (PDF).
- ↑ Pennsylvania Department of Education (2014). "Real Estate Tax Rates by School District 2014-15 Real Estate Mills".
- ↑ Pennsylvania Department of Education (2013). "Real Estate Tax Rates by School District 2013-14 Real Estate Mills".
- ↑ Pennsylvania Department of Education, Finances_Real Estate Tax Rates 2012-13, 2012
- ↑ Pennsylvania Department of Education (2011). "Real Estate Tax Millage by School District,".
- ↑ Pennsylvania Department of Education (2010). "Real Estate Tax Millage by School District,".
- ↑ Pennsylvania Department of Education, Financial Elements Reports, 2010
- ↑ Pennsylvania Department of Education, Financial Elements Reports 2008-09 Real Estate Mills, 2009
- ↑ Pennsylvania Department of Education, Real Estate Tax Millage by School District, 2008
- ↑ Pennsylvania Department of Education, Real Estate Tax Millage by School District, 2006
- ↑ Pennsylvania Department of Education, Real Estate Tax Millage by School District, 2005
- ↑ Tax-rates.org (2016). "Lehigh County Pennsylvania Property Taxes 2015".
- ↑ Tax-rates.org., The 2015 Tax Resource County Property Taxes 2015, 2016
- ↑ Pennsylvania Department of Education, Pennsylvania School Finances - Summaries of Annual Financial Report Data 2010-11, 2011
- ↑ New Census Data on Property Taxes on Homeowners, Tax Foundation, September 22, 2009
- ↑ Tax Foundation, The facts on Pennsylvania’s Tax Climate, January 2015
External links
Lehigh County, Pennsylvania Schools | |||||||||||||||||||||||||||||||||
|---|---|---|---|---|---|---|---|---|---|---|---|---|---|---|---|---|---|---|---|---|---|---|---|---|---|---|---|---|---|---|---|---|---|
| |||||||||||||||||||||||||||||||||
| |||||||||||||||||||||||||||||||||
Northampton County, Pennsylvania Schools | |||||||||||||||||||||||||||||||||
|---|---|---|---|---|---|---|---|---|---|---|---|---|---|---|---|---|---|---|---|---|---|---|---|---|---|---|---|---|---|---|---|---|---|
| |||||||||||||||||||||||||||||||||
| |||||||||||||||||||||||||||||||||