Borehole Image Logs
Borehole Imaging Logs are logging and data-processing methods used to produce two-dimensional, centimeter-scale images of a borehole wall and the rocks that make it up .These tools are limited to the open-hole environment. The applications where images are useful cover the full range the E&P cycle from exploration through appraisal, development, and production to abandonment.
Specific applications are sedimentology, structural geology/tectonics, reservoir geomechanics and drilling, reservoir engineering.
The tools can be categorized a number of ways: energy source (electrical, acoustic, or nuclear); conveyance (wireline or logging while drilling (LWD)); and mud type (water-based mud (WMD) or oil-based mud (OBM)).
Image Basics
What 2 dimensional means

Image logs are 2 dimensional data sets meaning that there are multiple values recorded at each depth and at different positions around the borehole. When projected onto a plane (like a computer screen or sheet of paper a 2D image is created.[1]
Tadpoles
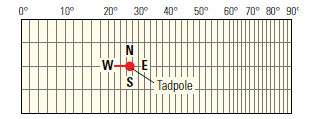
The planar features are quantified with a tadpole map that relates depth with the dip angle and dip direction of the plane.
Curves to images

The tool measures values that are recorded as a curve (or log). This curve is converted into a color strip that is merged with other strip from the tool to create the image.
Image normalization

The images can be normalized to a local color map to bring out hidden or subtle features.
References
- ↑ Schlumberger Oilfield Review, vol. 27, no. 2, (Sept 2015), pages 4-20
This article is issued from Wikipedia - version of the 6/19/2016. The text is available under the Creative Commons Attribution/Share Alike but additional terms may apply for the media files.