California's 25th congressional district
| California's 25th congressional district | ||
|---|---|---|
.tif.png) | ||
| Current Representative | Steve Knight (R–Palmdale) | |
| Ethnicity | 45.8% White, 8.0% Black, 7.7% Asian, 35.3% Hispanic, 3.2[1]% other | |
| Cook PVI | R+3 | |
California's 25th congressional district is a congressional district in the U.S. state of California that covers part of northern Los Angeles County and part of Ventura County. It includes the cities of Santa Clarita, Simi Valley, Palmdale, Lancaster, and the northern part of the San Fernando Valley. It is the most Republican congressional district to be located primarily in Los Angeles County.
The district is currently represented by Republican Steve Knight.
The 25th Congressional District of California will hold an election for the U.S. House of Representatives on November 8, 2016, with the primary election being held on June 7, 2016. The winners of this election will serve in the 115th United States Congress, with seats apportioned among the states based on the 2010 United States Census. Other Congressional Districts will be eligible for election. The 2016 Presidential election, 2016 Senate elections, 2016 gubernatorial elections, and many state and local elections will also be held on this date.
Candidates include:
Bryan Caforio (Democratic)[2][3]
Steve Knight (Republican)[4]
Jeffrey Moffatt (Republican)[5]
Lou Vince (Democratic)[6]
Jeff Bomberger (Independent) [7]
In May 2016 Caforio, Knight and Vince participated in a public debate that covered environmental issues, immigration, gun control, minimum wage and Social Security.[8]
Voting
| Election results from statewide races | ||
|---|---|---|
| Year | Office | Results |
| 2010 | Governor | Whitman 50.9 - 41.4% |
| Senator | Fiorina 54.0 - 38.9% | |
| 2008 | President[9] | Obama 49.4 - 48.3% |
| 2006 | Governor[10] | Schwarzenegger 66.4 - 28.5% |
| Senator[11] | Mountjoy 49.5 - 45.2% | |
| 2004 | President[12] | Bush 58.8 - 39.9% |
| Senator[13] | Jones 49.3 - 45.6% | |
| 2003 | Recall[14][15] | Yes 74.5 - 25.5% |
| Schwarzenegger 66.2 - 16.2% | ||
| 2002 | Governor[16] | Simon 57.5 - 34.3% |
| 2000 | President[17] | Bush 51.4 - 44.7% |
| Senator[18] | Feinstein 47.0 - 46.2% | |
| 1998 | Governor | |
| Senator | ||
| 1996 | President | |
| 1994 | Governor | |
| Senator | ||
| 1992 | President | Bush 39.0 - 36.1% |
| Senator | Herschensohn 53.9 - 36.6% | |
| Senator | Seymour 47.9 - 43.1% | |
List of representatives
| Representative | Party | Dates | Notes | Counties |
|---|---|---|---|---|
| District created | January 3, 1953 | |||
 Patrick J. Hillings Patrick J. Hillings |
Republican | January 3, 1953 – January 3, 1959 | Redistricted from the 12th district Retired to run for Attorney General |
Los Angeles |
.jpg) George A. Kasem George A. Kasem |
Democratic | January 3, 1959 – January 3, 1961 | Lost re-election | |
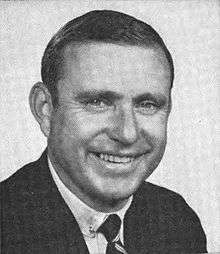 John H. Rousselot John H. Rousselot |
Republican | January 3, 1961 – January 3, 1963 | Lost re-election | |
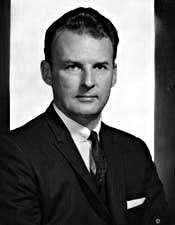 Ronald B. Cameron Ronald B. Cameron |
Democratic | January 3, 1963 – January 3, 1967 | Lost re-election | |
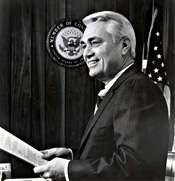 Charles E. Wiggins Charles E. Wiggins |
Republican | January 3, 1967 – January 3, 1973 | Los Angeles, Orange | |
| January 3, 1973 – January 3, 1975 | Redistricted to the 39th district | Los Angeles | ||
 Edward R. Roybal Edward R. Roybal |
Democratic | January 3, 1975 – January 3, 1983 | Redistricted from the 30th district | |
| January 3, 1983 – January 3, 1993 | Retired | Central/eastern Los Angeles | ||
 Howard McKeon Howard McKeon |
Republican | January 3, 1993 – January 3, 2003 | Northern Los Angeles | |
| January 3, 2003 – January 3, 2013 | Inyo, northern Los Angeles, Mono, northwestern San Bernardino | |||
| January 3, 2013 – January 3, 2015 | Retired | Northern Los Angeles including Palmdale and Santa Clarita, northeastern Ventura including Simi Valley | ||
 Steve Knight Steve Knight |
Republican | January 3, 2015 – | ||
Election results
|
1952 • 1954 • 1956 • 1958 • 1960 • 1962 • 1964 • 1966 • 1968 • 1970 • 1972 • 1974 • 1976 • 1978 • 1980 • 1982 • 1984 • 1986 • 1988 • 1990 • 1992 • 1994 • 1996 • 1998 • 2000 • 2002 • 2004 • 2006 • 2008 • 2010 • 2012 |
1952
| Party | Candidate | Votes | % | |
|---|---|---|---|---|
| Republican | Patrick J. Hillings (incumbent) | 135,465 | 64.3 | |
| Democratic | Woodrow Wilson Sayre | 75,125 | 35.7 | |
| Total votes | 210,590 | 100.0 | ||
| Voter turnout | % | |||
| Republican hold | ||||
1954
| Party | Candidate | Votes | % | |
|---|---|---|---|---|
| Republican | Patrick J. Hillings (incumbent) | 113,027 | 65.2 | |
| Democratic | John S. Sobieski | 60,370 | 34.8 | |
| Total votes | 173,397 | 100.0 | ||
| Voter turnout | % | |||
| Republican hold | ||||
1956
| Party | Candidate | Votes | % | |
|---|---|---|---|---|
| Republican | Patrick J. Hillings (incumbent) | 166,305 | 63.8 | |
| Democratic | John S. Sobieski | 94,180 | 36.2 | |
| Total votes | 260,485 | 100.0 | ||
| Voter turnout | % | |||
| Republican hold | ||||
1958
| Party | Candidate | Votes | % | |||
|---|---|---|---|---|---|---|
| Democratic | George A. Kasem | 135,009 | 50.1 | |||
| Republican | Prescott O. Lieberg | 134,406 | 49.9 | |||
| Total votes | 269,415 | 100.0 | ||||
| Voter turnout | % | |||||
| Democratic gain from Republican | ||||||
1960
| Party | Candidate | Votes | % | |||
|---|---|---|---|---|---|---|
| Republican | John H. Rousselot | 182,545 | 53.6 | |||
| Democratic | George A. Kasem (inc.) | 158,289 | 46.4 | |||
| Total votes | 340,834 | 100.0 | ||||
| Voter turnout | % | |||||
| Republican gain from Democratic | ||||||
1962
| Party | Candidate | Votes | % | |||
|---|---|---|---|---|---|---|
| Democratic | Ronald B. Cameron | 62,371 | 53.6 | |||
| Republican | John H. Rousselot (inc.) | 53,961 | 46.4 | |||
| Total votes | 116,332 | 100.0 | ||||
| Voter turnout | % | |||||
| Democratic gain from Republican | ||||||
1964
| Party | Candidate | Votes | % | |
|---|---|---|---|---|
| Democratic | Ronald B. Cameron (inc.) | 81,320 | 55.4 | |
| Republican | Frank J. Walton | 65,344 | 44.6 | |
| Total votes | 146,664 | 100.0 | ||
| Voter turnout | % | |||
| Democratic hold | ||||
1966
| Party | Candidate | Votes | % | |||
|---|---|---|---|---|---|---|
| Republican | Charles E. Wiggins | 70,154 | 52.6 | |||
| Democratic | Ronald B. Cameron (inc.) | 63,345 | 47.4 | |||
| Total votes | 133,499 | ' | ||||
| Republican gain from Democratic | ||||||
1968
| Party | Candidate | Votes | % | |
|---|---|---|---|---|
| Republican | Charles E. Wiggins (inc.) | 141,600 | 68.6 | |
| Democratic | Keith F. Shirey | 64,732 | 31.4 | |
| Total votes | 206,332 | 100.0 | ||
| Voter turnout | % | |||
| Republican hold | ||||
1970
| Party | Candidate | Votes | % | |
|---|---|---|---|---|
| Republican | Charles E. Wiggins (inc.) | 116,169 | 63.3 | |
| Democratic | Leslie W. "Les" Craven | 64,386 | 35.1 | |
| American Independent | Kevin Scanlon | 2,994 | 1.6 | |
| Total votes | 183,549 | 100.0 | ||
| Voter turnout | % | |||
| Republican hold | ||||
1972
| Party | Candidate | Votes | % | |
|---|---|---|---|---|
| Republican | Charles E. Wiggins (inc.) | 115,908 | 64.9 | |
| Democratic | Leslie W. "Les" Craven | 50,015 | 31.9 | |
| American Independent | Alfred Romirez | 5,541 | 3.1 | |
| Total votes | 171,464 | 100.0 | ||
| Voter turnout | % | |||
| Republican hold | ||||
1974
| Party | Candidate | Votes | % | |
|---|---|---|---|---|
| Democratic | Edward R. Roybal (incumbent) | 43,998 | 100.0 | |
| Voter turnout | % | |||
| Democratic hold | ||||
1976
| Party | Candidate | Votes | % | |
|---|---|---|---|---|
| Democratic | Edward R. Roybal (incumbent) | 57,966 | 71.9 | |
| Republican | Robert K. Watson | 17,737 | 22.0 | |
| Peace and Freedom | Marilyn Se | 4,922 | 6.1 | |
| Total votes | 80,625 | 100.0 | ||
| Voter turnout | % | |||
| Democratic hold | ||||
1978
| Party | Candidate | Votes | % | |
|---|---|---|---|---|
| Democratic | Edward R. Roybal (incumbent) | 45,881 | 67.4 | |
| Republican | Robert K. Watson | 22,205 | 32.6 | |
| Total votes | 68,086 | 100.0 | ||
| Voter turnout | % | |||
| Democratic hold | ||||
1980
| Party | Candidate | Votes | % | |
|---|---|---|---|---|
| Democratic | Edward R. Roybal (incumbent) | 49,080 | 66.0 | |
| Republican | Richard E. Ferraro | 21,116 | 28.4 | |
| Libertarian | William D. Mitchell | 4,169 | 5.6 | |
| Total votes | 74,365 | 100.0 | ||
| Voter turnout | % | |||
| Democratic hold | ||||
1982
| Party | Candidate | Votes | % | |
|---|---|---|---|---|
| Democratic | Edward R. Roybal (incumbent) | 71,106 | 84.5 | |
| Libertarian | Daniel John Gorham | 12,060 | 14.5 | |
| Total votes | 83,166 | 100.0 | ||
| Voter turnout | % | |||
| Democratic hold | ||||
1984
| Party | Candidate | Votes | % | |
|---|---|---|---|---|
| Democratic | Edward R. Roybal (incumbent) | 74,261 | 71.7 | |
| Republican | Roy D. "Bill" Bloxom | 24,968 | 24.1 | |
| Libertarian | Anthony G. Bajada | 4,370 | 4.2 | |
| Total votes | 103,599 | 100.0 | ||
| Voter turnout | % | |||
| Democratic hold | ||||
1986
| Party | Candidate | Votes | % | |
|---|---|---|---|---|
| Democratic | Edward R. Roybal (incumbent) | 62,692 | 76.1 | |
| Republican | Gregory L. Hardy | 17,558 | 21.3 | |
| Libertarian | Ted Brown | 2,163 | 2.6 | |
| Total votes | 82,413 | 100.0 | ||
| Voter turnout | % | |||
| Democratic hold | ||||
1988
| Party | Candidate | Votes | % | |
|---|---|---|---|---|
| Democratic | Edward R. Roybal (incumbent) | 85,378 | 85.5 | |
| Peace and Freedom | Paul Reyes | 8,746 | 8.8 | |
| Libertarian | John C. Thie | 5,752 | 5.8 | |
| Total votes | 98,876 | 100.0 | ||
| Voter turnout | % | |||
| Democratic hold | ||||
1990
| Party | Candidate | Votes | % | |
|---|---|---|---|---|
| Democratic | Edward R. Roybal (incumbent) | 48,120 | 70.0 | |
| Republican | Steven J. Renshaw | 17,021 | 24.8 | |
| Libertarian | Robert H. Scott | 3,576 | 5.2 | |
| Total votes | 68,717 | 100.0 | ||
| Voter turnout | % | |||
| Democratic hold | ||||
1992
| Party | Candidate | Votes | % | ||
|---|---|---|---|---|---|
| Republican | Buck McKeon | 113,611 | 51.9 | ||
| Democratic | James H. Gilmartin | 72,233 | 33.0 | ||
| Independent | Rick Pamplin | 13,930 | 6.4 | ||
| Libertarian | Peggy L. Christensen | 6,932 | 3.2 | ||
| Green | Charles Wilken | 6,919 | 3.2 | ||
| Peace and Freedom | Nancy Lawrence | 5,090 | 2.3 | ||
| Total votes | 218,715 | 100.0 | |||
| Voter turnout | % | ||||
| Republican win (new seat) | |||||
1994
| Party | Candidate | Votes | % | |
|---|---|---|---|---|
| Republican | Buck McKeon (incumbent) | 110,301 | 64.89 | |
| Democratic | James H. Gilmartin | 53,445 | 31.44 | |
| Libertarian | Devin Cutler | 6,205 | 3.65 | |
| No party | Tulley (write-in) | 20 | 0.01% | |
| Total votes | 169,971 | 100.0 | ||
| Voter turnout | % | |||
| Republican hold | ||||
1996
| Party | Candidate | Votes | % | |
|---|---|---|---|---|
| Republican | Buck McKeon (incumbent) | 122,428 | 62.4 | |
| Democratic | Diane Trautman | 65,089 | 33.2 | |
| Libertarian | Bruce Acker | 6,173 | 3.2 | |
| Peace and Freedom | Justin Gerber | 2,513 | 1.2 | |
| Total votes | 196,203 | 100.0 | ||
| Voter turnout | % | |||
| Republican hold | ||||
1998
| Party | Candidate | Votes | % | |
|---|---|---|---|---|
| Republican | Buck McKeon (incumbent) | 114,013 | 74.67 | |
| Libertarian | Bruce Acker | 38,669 | 25.33 | |
| Total votes | 152,682 | 100.0 | ||
| Voter turnout | % | |||
| Republican hold | ||||
2000
| Party | Candidate | Votes | % | |
|---|---|---|---|---|
| Republican | Buck McKeon (incumbent) | 138,628 | 62.3 | |
| Democratic | Sid Gold | 73,921 | 33.2 | |
| Libertarian | Bruce R. Acker | 7,219 | 3.2 | |
| Natural Law | Mews Small | 3,010 | 1.3 | |
| Total votes | 222,778 | 100.0 | ||
| Voter turnout | % | |||
| Republican hold | ||||
2002
| Party | Candidate | Votes | % | |
|---|---|---|---|---|
| Republican | Buck McKeon (incumbent) | 80,775 | 65.0 | |
| Democratic | Bob Conaway | 38,674 | 31.1 | |
| Libertarian | Frank M. Consolo, Jr. | 4,887 | 3.9 | |
| Total votes | 124,336 | 100.0 | ||
| Voter turnout | % | |||
| Republican hold | ||||
2004
| Party | Candidate | Votes | % | |
|---|---|---|---|---|
| Republican | Buck McKeon (incumbent) | 145,575 | 64.5 | |
| Democratic | Fred "Tim" Willoughby | 80,395 | 35.5 | |
| Total votes | 225,970 | 100.0 | ||
| Voter turnout | % | |||
| Republican hold | ||||
2006
| Party | Candidate | Votes | % | |
|---|---|---|---|---|
| Republican | Buck McKeon (incumbent) | 93,987 | 60.0 | |
| Democratic | Robert Rodriguez | 55,913 | 35.7 | |
| Libertarian | David W. Erickson | 6,873 | 4.3 | |
| Total votes | 156,773 | 100.0 | ||
| Voter turnout | % | |||
| Republican hold | ||||
2008
| Party | Candidate | Votes | % | |
|---|---|---|---|---|
| Republican | Howard McKeon (incumbent) | 144,660 | 57.73 | |
| Democratic | Jackie Conaway | 105,929 | 42.27 | |
| Total votes | 250,589 | 100.00 | ||
| Voter turnout | 72.24% | |||
| Republican hold | ||||
2010
| Party | Candidate | Votes | % | |
|---|---|---|---|---|
| Republican | Howard McKeon (incumbent) | 118,308 | 61.83 | |
| Democratic | Jackie Conaway | 73,028 | 38.17 | |
| Total votes | 191,336 | 100.00 | ||
| Voter turnout | % | |||
| Republican hold | ||||
2012
| Party | Candidate | Votes | % | |
|---|---|---|---|---|
| Republican | Howard McKeon (incumbent) | 121,593 | 55% | |
| Democratic | Lee Rogers | 106,982 | 45% | |
| Total votes | 236,575 | 100% | ||
| Voter turnout | % | |||
| Republican hold | ||||
2014
| Party | Candidate | Votes | % | |
|---|---|---|---|---|
| Republican | Steve Knight | 60,847 | 53% | |
| Republican | Tony Strickland | 53,225 | 47% | |
| Total votes | 113,172 | 100% | ||
| Voter turnout | % | |||
| Republican hold | ||||
Living former Members
As of April 2015, there is one former member of the U.S. House of Representatives from California's 24th congressional district that is currently living.
| Representative | Term in office | Date of birth (and age) |
|---|---|---|
| Howard McKeon | 1993 - 2015 | September 9, 1938 |
Historical district boundaries
- [Map needs to be updated]

See also
References
- ↑ http://www.latimes.com/la-redistricting-map-july-2011,0,5339409.htmlstory#39.71057374407184,-118.14590136718749,5,usCongress,,,current
- ↑ "Democratic lawyer announcing challenge to GOP Rep. Steve Knight". Los Angeles Times. 2015-12-10. Retrieved 2015-12-10.
- ↑ The Invisible Catastrophe The New York Times, March 31, 2016
- ↑ "Knight: 2nd Quarter Will Quell Fundraising Doubts". The Hill. May 21, 2015. Retrieved May 22, 2015.
- ↑ Holt, Jim (March 13, 2016). "Deck shuffled for SCV June primary". The Santa Clarita Valley Signal. Retrieved March 16, 2016.
- ↑ Merl, Jean (April 30, 2015). "Democrat Lou Vince says he will challenge Rep. Stephen Knight". Los Angeles Times. Retrieved May 4, 2015.
- ↑ "California Secretary of State Certified Write-In List" (PDF).
- ↑ Candid debate at Hart Hall the Santa Clarita Valley Signal, May 5, 2016
- ↑ (2008 President)
- ↑ Statement of Vote (2006 Governor)
- ↑ Statement of Vote (2006 Senator)
- ↑ Statement of Vote (2004 President)
- ↑ Statement of Vote (2004 Senator)
- ↑ Statement of Vote (2003 Recall Question)
- ↑ Statement of Vote (2003 Governor)
- ↑ Statement of Vote (2002 Governor)
- ↑ Statement of Vote (2000 President)
- ↑ Statement of Vote (2000 Senator)
- ↑ 1952 election results
- ↑ 1954 election results
- ↑ 1956 election results
- ↑ 1958 election results
- ↑ 1960 election results
- ↑ 1962 election results
- ↑ 1964 election results
- ↑ 1966 election results
- ↑ 1968 election results
- ↑ 1970 election results
- ↑ 1972 election results
- ↑ 1974 election results
- ↑ 1976 election results
- ↑ 1978 election results
- ↑ 1980 election results
- ↑ 1982 election results
- ↑ 1984 election results
- ↑ 1986 election results
- ↑ 1988 election results
- ↑ 1990 election results
- ↑ 1992 election results
- ↑ 1994 election results
- ↑ 1996 election results
- ↑ 1998 election results
- ↑ 2000 election results
- ↑ 2002 general election results Archived February 3, 2009, at the Wayback Machine.
- ↑ 2004 general election results
- ↑ 2006 general election results Archived November 27, 2008, at the Wayback Machine.
- ↑
- ↑ http://www.sos.ca.gov/elections/sov/2010-general/58-united-states-representative.pdf
- ↑ "Archived copy" (PDF). Archived from the original (PDF) on 2013-10-19. Retrieved 2014-01-21.
- ↑
External links
- GovTrack.us: California's 25th congressional district
- RAND California Election Returns: District Definitions
- California Voter Foundation map - CD25
Coordinates: 35°48′N 117°12′W / 35.8°N 117.2°W