California's 27th congressional district
| California's 27th congressional district | ||
|---|---|---|
.tif.png) | ||
| Current Representative | Judy Chu (D–Monterey Park) | |
| Ethnicity | 29.2% White, 4.5% Black, 37.0% Asian, 26.9% Hispanic, 2.5[1]% other | |
| Cook PVI | D+11 | |
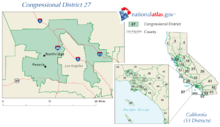
California's 27th congressional district is a congressional district in the U.S. state of California
The district is currently represented by Democrat Judy Chu. The district covers the San Gabriel Foothills including the communities of Alhambra , Altadena, Arcadia, Bradbury, Claremont, East Pasadena, Glendora, Monrovia, Monterey Park, Pasadena, Rosemead, San Antonio Heights, San Gabriel, San Marino, Sierra Madre, South Pasadena, South San Gabriel, Temple City, and Upland.
Voting
| Election results from statewide races | ||
|---|---|---|
| Year | Office | Results |
| 2012 | President | Obama 62.6 - 35.0% |
| 2010 | Governor | Brown 57.9 - 36.8% |
| Senator | Boxer 57.6 - 36.7% | |
| 2008 | President[2] | Obama 66.1 - 31.7% |
| 2006 | Governor[3] | Schwarzenegger 52.7 - 42.3% |
| Senator[4] | Feinstein 63.2 - 31.3% | |
| 2004 | President[5] | Kerry 59.3 - 39.3% |
| Senator[6] | Boxer 63.7 - 31.2% | |
| 2003 | Recall[7][8] | Yes 56.5 - 43.5% |
| Schwarzenegger 52.0 - 29.9% | ||
| 2002 | Governor[9] | Davis 50.1 - 40.0% |
| 2000 | President[10] | Gore 53.4 - 41.4% |
| Senator[11] | Feinstein 56.6 - 36.4% | |
| 1998 | Governor | |
| Senator | ||
| 1996 | President | |
| 1994 | Governor | |
| Senator | ||
| 1992 | President | Clinton 44.3 - 36.6% |
| Senator | Herschensohn 47.5 - 44.9% | |
| Senator | Feinstein 50.7 - 42.1% | |
List of representatives
| Representative | Party | Years | Notes | Counties |
|---|---|---|---|---|
| District created | January 3, 1953 | |||
 Harry R. Sheppard Harry R. Sheppard |
Democratic | January 3, 1953 – January 3, 1963 | Redistricted from the 21st district Redistricted to the 33rd district |
San Bernardino |
 Everett G. Burkhalter Everett G. Burkhalter |
Democratic | January 3, 1963 – January 3, 1965 | Lost re-election | Los Angeles |
 Edwin Reinecke Edwin Reinecke |
Republican | January 3, 1965 – January 21, 1969 | Resigned to become Lieutenant Governor of California | |
| Vacant | January 21, 1969 – April 29, 1969 | |||
 Barry Goldwater, Jr. Barry Goldwater, Jr. |
Republican | April 29, 1969 – January 3, 1973 | ||
| January 3, 1973 – January 3, 1975 | Redistricted to the 20th district | Los Angeles, southern Ventura | ||
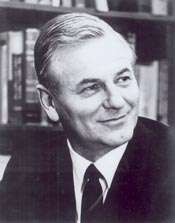 Alphonzo E. Bell, Jr. Alphonzo E. Bell, Jr. |
Republican | January 3, 1975 – January 3, 1977 | Redistricted from the 28th district Retired to run for the US Senate |
Los Angeles |
 Bob Dornan Bob Dornan |
Republican | January 3, 1977 – January 3, 1983 | Retired to run for the US Senate | |
 Mel Levine Mel Levine |
Democratic | January 3, 1983 – January 3, 1993 | Retired | Western Los Angeles (Manhattan/Redondo Beach, Santa Monica) |
 Carlos Moorhead Carlos Moorhead |
Republican | January 3, 1993 – January 3, 1997 | Redistricted from the 22nd district Retired |
Los Angeles (Burbank, Glendale, Pasadena) |
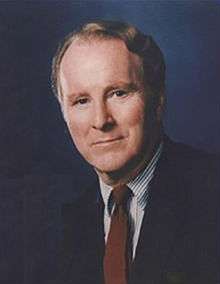
 Jim Rogan Jim Rogan |
Republican | January 3, 1997 – January 3, 2001 | Lost re-election | |
 Adam Schiff Adam Schiff |
Democratic | January 3, 2001 – January 3, 2003 | Redistricted to the 29th district | |
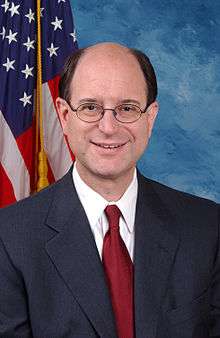 Brad Sherman Brad Sherman |
Democratic | January 3, 2003 – January 3, 2013 | Redistricted from the 24th district Redistricted to the 30th district |
Western Los Angeles (Northridge) |
 Judy Chu Judy Chu |
Democratic | January 3, 2013 – present | Redistricted from the 32nd district | San Gabriel Foothills including Alhambra and Pasadena |
Election results
|
1952 • 1954 • 1956 • 1958 • 1960 • 1962 • 1964 • 1966 • 1968 • 1969 (Special) • 1970 • 1972 • 1974 • 1976 • 1978 • 1980 • 1982 • 1984 • 1986 • 1988 • 1990 • 1992 • 1994 • 1996 • 1998 • 2000 • 2002 • 2004 • 2006 • 2008 • 2010 • 2012 • 2014 |
1952
| Party | Candidate | Votes | % | |
|---|---|---|---|---|
| Democratic | Harry R. Sheppard (inc.) | 68,773 | 55.0 | |
| Republican | Carl B. Hilliard | 56,202 | 45.0 | |
| Total votes | 124,975 | 100.0 | ||
| Voter turnout | % | |||
| Democratic hold | ||||
1954
| Party | Candidate | Votes | % | |
|---|---|---|---|---|
| Democratic | Harry R. Sheppard (inc.) | 65,389 | 64.8 | |
| Republican | Martin K. Barrett | 35,594 | 35.2 | |
| Total votes | 100,983 | 100.0 | ||
| Voter turnout | % | |||
| Democratic hold | ||||
1956
| Party | Candidate | Votes | % | |
|---|---|---|---|---|
| Democratic | Harry R. Sheppard (inc.) | 124,662 | 100.0 | |
| Voter turnout | % | |||
| Democratic hold | ||||
1958
| Party | Candidate | Votes | % | |
|---|---|---|---|---|
| Democratic | Harry R. Sheppard (inc.) | 105,062 | 72.3 | |
| Republican | Robert M. Castle | 40,317 | 27.7 | |
| Total votes | 145,379 | 100.0 | ||
| Voter turnout | % | |||
| Democratic hold | ||||
1960
| Party | Candidate | Votes | % | |
|---|---|---|---|---|
| Democratic | Harry R. Sheppard (inc.) | 123,645 | 66.8 | |
| Republican | Robert M. Castle | 61,484 | 33.2 | |
| Total votes | 185,129 | 100.0 | ||
| Voter turnout | % | |||
| Democratic hold | ||||
1962
| Party | Candidate | Votes | % | |||
|---|---|---|---|---|---|---|
| Democratic | Everett G. Burkhalter | 66,979 | 52.1 | |||
| Republican | Edgar W. Hiestand (inc.) | 61,538 | 47.9 | |||
| Total votes | 128,517 | 100.0 | ||||
| Voter turnout | % | |||||
| Democratic gain from Republican | ||||||
1964
| Party | Candidate | Votes | % | |||
|---|---|---|---|---|---|---|
| Republican | Edwin Reinecke | 83,141 | 51.7 | |||
| Democratic | Tom Bane | 77,587 | 48.3 | |||
| Total votes | 160,734 | 100.0 | ||||
| Voter turnout | % | |||||
| Republican gain from Democratic | ||||||
1966
| Party | Candidate | Votes | % | |
|---|---|---|---|---|
| Republican | Edwin Reinecke (incumbent) | 93,890 | 65.3 | |
| Democratic | John A. "Jack" Howard | 49,785 | 34.7 | |
| Total votes | 143,675 | 100.0 | ||
| Voter turnout | % | |||
| Republican hold | ||||
1968
| Party | Candidate | Votes | % | |
|---|---|---|---|---|
| Republican | Edwin Reinecke (incumbent) | 158,309 | 72.2 | |
| Democratic | John T. Butchko | 60,808 | 27.8 | |
| Total votes | 219,117 | 100.0 | ||
| Voter turnout | % | |||
| Republican hold | ||||
1969 (Special)
| Party | Candidate | Votes | % | |
|---|---|---|---|---|
| Republican | Barry Goldwater, Jr. | ' | 56.9 | |
| Democratic | John K. Van de Kamp | 43.1 | ||
| Total votes | {{{votes}}} | 100.0 | ||
| Voter turnout | % | |||
| Republican hold | ||||
1970
| Party | Candidate | Votes | % | |
|---|---|---|---|---|
| Republican | Barry Goldwater, Jr. | 139,326 | 66.6 | |
| Democratic | N. "Toni" Kimmel | 63,652 | 30.5 | |
| Peace and Freedom | Edward Richer | 3,306 | 1.6 | |
| American Independent | John H. Hind | 2,642 | 1.3 | |
| Total votes | 208,926 | 100.0 | ||
| Voter turnout | % | |||
| Republican hold | ||||
1972
| Party | Candidate | Votes | % | |
|---|---|---|---|---|
| Republican | Barry Goldwater, Jr. (inc.) | 117,622 | 57.4 | |
| Democratic | Mark S. Novak | 87,295 | 42.6 | |
| Total votes | 204,917 | 100.0 | ||
| Voter turnout | % | |||
| Republican hold | ||||
1974
| Party | Candidate | Votes | % | |
|---|---|---|---|---|
| Republican | Alphonzo E. Bell, Jr. (inc.) | 99,645 | 63.9 | |
| Democratic | John Dalessio | 50,919 | 32.5 | |
| Peace and Freedom | Jerry Rubin | 5,547 | 3.6 | |
| Total votes | 156,111 | 100.0 | ||
| Voter turnout | % | |||
| Republican hold | ||||
1976
| Party | Candidate | Votes | % | |
|---|---|---|---|---|
| Republican | Bob Dornan | 114,623 | 54.7 | |
| Democratic | Gary Familian | 94,988 | 45.3 | |
| Total votes | 209,611 | 100.0 | ||
| Voter turnout | % | |||
| Republican hold | ||||
1978
| Party | Candidate | Votes | % | |
|---|---|---|---|---|
| Republican | Bob Dornan (incumbent) | 89,392 | 51 | |
| Democratic | Carey Peck | 85,880 | 49 | |
| Total votes | 175,272 | 100.0 | ||
| Voter turnout | % | |||
| Republican hold | ||||
1980
| Party | Candidate | Votes | % | |
|---|---|---|---|---|
| Republican | Bob Dornan (incumbent) | 109,807 | 51.0 | |
| Democratic | Carey Peck | 100,061 | 46.5 | |
| Libertarian | Jerome L. "Jerry" Sievers | 5,448 | 2.5 | |
| Total votes | 215,316 | 100.0 | ||
| Voter turnout | % | |||
| Republican hold | ||||
1982
| Party | Candidate | Votes | % | |||
|---|---|---|---|---|---|---|
| Democratic | Mel Levine | 108,347 | 59.5 | |||
| Republican | Bart W. Christensen | 67,479 | 37.0 | |||
| Libertarian | ZacK Richardson | 6,391 | 3.5 | |||
| Total votes | 182,217 | 100.0 | ||||
| Voter turnout | % | |||||
| Democratic gain from Republican | ||||||
1984
| Party | Candidate | Votes | % | |
|---|---|---|---|---|
| Democratic | Mel Levine (incumbent) | 116,933 | 55.0 | |
| Republican | Robert B. Scribner | 88,896 | 41.8 | |
| Peace and Freedom | Thomas L. O'Connor, Jr. | 3,815 | 1.8 | |
| Libertarian | Jeff Avrech | 3,137 | 1.5 | |
| Total votes | 212,781 | 100.0 | ||
| Voter turnout | % | |||
| Democratic hold | ||||
1986
| Party | Candidate | Votes | % | |
|---|---|---|---|---|
| Democratic | Mel Levine (incumbent) | 110,403 | 63.7 | |
| Republican | Rob Scribner | 59,410 | 34.3 | |
| Peace and Freedom | Thomas L. O'Connor, Jr. | 2,078 | 1.2 | |
| Libertarian | Larry Leathers | 1,429 | 0.8 | |
| Total votes | 173,320 | 100.0 | ||
| Voter turnout | % | |||
| Democratic hold | ||||
1988
| Party | Candidate | Votes | % | |
|---|---|---|---|---|
| Democratic | Mel Levine (incumbent) | 148,814 | 67.5 | |
| Republican | Dennis Galbraith | 65,307 | 29.6 | |
| Libertarian | William J. Fulco | 6,214 | 2.8 | |
| Total votes | 220,335 | 100.0 | ||
| Voter turnout | % | |||
| Democratic hold | ||||
1990
| Party | Candidate | Votes | % | |
|---|---|---|---|---|
| Democratic | Mel Levine (incumbent) | 90,857 | 58.2 | |
| Republican | David Barrett Cohen | 58,140 | 37.2 | |
| Peace and Freedom | Edward E. Ferrer | 7,101 | 4.5 | |
| Total votes | 156,098 | 100.0 | ||
| Voter turnout | % | |||
| Democratic hold | ||||
1992
| Party | Candidate | Votes | % | |
|---|---|---|---|---|
| Republican | Carlos Moorhead (inc.) | 105,521 | 49.7 | |
| Democratic | Doug Kahn | 83,805 | 39.4 | |
| Green | Jesse A. Moorman | 11,003 | 5.2 | |
| Peace and Freedom | Margaret L. Edwards | 7,329 | 3.5 | |
| Libertarian | Dennis Decherd | 4,790 | 2.3 | |
| No party | Ballantyne (write-in) | 2 | 0.0% | |
| Total votes | 212,450 | 100.0 | ||
| Voter turnout | % | |||
| Republican hold | ||||
1994
| Party | Candidate | Votes | % | |
|---|---|---|---|---|
| Republican | Carlos Moorhead (inc.) | 88,341 | 52.97 | |
| Democratic | Doug Kahn | 70,267 | 42.13 | |
| American Independent | Bill Gibbs | 4,328 | 2.60 | |
| Libertarian | Dennis Decherd | 3,838 | 2.30 | |
| Total votes | 166,774 | 100.0 | ||
| Voter turnout | % | |||
| Republican hold | ||||
1996
| Party | Candidate | Votes | % | |
|---|---|---|---|---|
| Republican | Jim Rogan | 95,310 | 50.2 | |
| Democratic | Doug Kahn | 82,014 | 43.2 | |
| Libertarian | Elizabeth Michael | 6,645 | 3.5 | |
| Green | Walt Sheasby | 4,195 | 3.3 | |
| Natural Law | Martin Zucker | 1,766 | 0.9 | |
| Total votes | 189,930 | 100.0 | ||
| Voter turnout | % | |||
| Republican hold | ||||
1998
| Party | Candidate | Votes | % | |
|---|---|---|---|---|
| Republican | Jim Rogan (incumbent) | 80,702 | 50.73 | |
| Democratic | Barry A. Gordon | 73,875 | 46.44 | |
| Libertarian | Bob New | 4,489 | 2.82 | |
| Total votes | 159,066 | 100.0 | ||
| Voter turnout | % | |||
| Republican hold | ||||
2000
| Party | Candidate | Votes | % | |||
|---|---|---|---|---|---|---|
| Democratic | Adam Schiff | 113,708 | 52.7 | |||
| Republican | Jim Rogan (incumbent) | 94,518 | 43.9 | |||
| Natural Law | Miriam R. Hospodar | 3,873 | 1.7 | |||
| Libertarian | Ted Brown | 3,675 | 1.7 | |||
| Total votes | 215,774 | 100.0 | ||||
| Voter turnout | % | |||||
| Democratic gain from Republican | ||||||
2002
| Party | Candidate | Votes | % | |
|---|---|---|---|---|
| Democratic | Brad Sherman (incumbent) | 79,815 | 62.0 | |
| Republican | Robert M. Levy | 48,996 | 38.0 | |
| Total votes | 128,811 | 100.0 | ||
| Voter turnout | % | |||
| Democratic hold | ||||
2004
| Party | Candidate | Votes | % | |
|---|---|---|---|---|
| Democratic | Brad Sherman (incumbent) | 125,296 | 62.3 | |
| Republican | Robert M. Levy | 66,946 | 33.3 | |
| Green | Eric J. Carter | 8,956 | 4.4 | |
| Total votes | 201,198 | 100.0 | ||
| Voter turnout | % | |||
| Democratic hold | ||||
2006
| Party | Candidate | Votes | % | |
|---|---|---|---|---|
| Democratic | Brad Sherman (incumbent) | 92,650 | 68.8 | |
| Republican | Peter Hankwitz | 42,074 | 31.2 | |
| Total votes | 134,724 | 100.0 | ||
| Voter turnout | % | |||
| Democratic hold | ||||
2008
| Party | Candidate | Votes | % | |
|---|---|---|---|---|
| Democratic | Brad Sherman (incumbent) | 135,665 | 68 | |
| Republican | Navraj Singh | 49,510 | 25 | |
| Total votes | 185,175 | 100.0 | ||
| Voter turnout | % | |||
| Democratic hold | ||||
2010
| Party | Candidate | Votes | % | |
|---|---|---|---|---|
| Democratic | Brad Sherman (incumbent) | 102,927 | 65.15 | |
| Republican | Mark Reed | 55,056 | 34.85 | |
| Total votes | 157,983 | 100.00 | ||
| Voter turnout | % | |||
| Democratic hold | ||||
2012
| Party | Candidate | Votes | % | |
|---|---|---|---|---|
| Democratic | Judy Chu (incumbent) | 154,191 | 64.0 | |
| Republican | Jack Orswell | 86,817 | 36.0 | |
| Total votes | 241,008 | 100.0 | ||
| Democratic hold | ||||
2014
| Party | Candidate | Votes | % | |
|---|---|---|---|---|
| Democratic | Judy Chu (incumbent) | 75,728 | 59% | |
| Republican | Jack Orswell | 51,852 | 41% | |
| Total votes | 127,580 | 100% | ||
| Democratic hold | ||||
Living former Members
As of April 2015, there are three former members of the U.S. House of Representatives from California's 27th congressional district that are currently living.
| Representative | Term in office | Date of birth (and age) |
|---|---|---|
| James E. Rogan | 1997 - 2001 | August 21, 1957 |
| Adam Schiff | 2001 - 2003 | June 22, 1960 |
| Brad Sherman | 2003 - 2013 | October 24, 1954 |
Historical district boundaries
See also
References
- ↑ http://www.latimes.com/la-redistricting-map-july-2011,0,5339409.htmlstory#39.71057374407184,-118.14590136718749,5,usCongress,,,current
- ↑ (2008 President)
- ↑ Statement of Vote (2006 Governor)
- ↑ Statement of Vote (2006 Senator)
- ↑ Statement of Vote (2004 President)
- ↑ Statement of Vote (2004 Senator)
- ↑ Statement of Vote (2003 Recall Question)
- ↑ Statement of Vote (2003 Governor)
- ↑ Statement of Vote (2002 Governor)
- ↑ Statement of Vote (2000 President)
- ↑ Statement of Vote (2000 Senator)
- ↑ 1952 election results
- ↑ 1954 election results
- ↑ 1956 election results
- ↑ 1958 election results
- ↑ 1960 election results
- ↑ 1962 election results
- ↑ 1964 election results
- ↑ 1966 election results
- ↑ 1968 election results
- ↑ 1969 special election results
- ↑ 1970 election results
- ↑ 1972 election results
- ↑ 1974 election results
- ↑ 1976 election results
- ↑ 1978 election results
- ↑ 1980 election results
- ↑ 1982 election results
- ↑ 1984 election results
- ↑ 1986 election results
- ↑ 1988 election results
- ↑ 1990 election results
- ↑ 1992 election results
- ↑ 1994 election results
- ↑ 1996 election results
- ↑ 1998 election results
- ↑ 2000 election results
- ↑ 2002 general election results Archived February 3, 2009, at the Wayback Machine.
- ↑ 2004 general election results
- ↑ 2006 general election results Archived November 27, 2008, at the Wayback Machine.
- ↑
- ↑
- ↑ 2012 general election results Archived October 19, 2013, at the Wayback Machine.
- ↑ 2012 general election results Archived October 19, 2013, at the Wayback Machine.
External links
- GovTrack.us: California's 27th congressional district
- RAND California Election Returns: District Definitions
- California Voter Foundation map - CD27
Coordinates: 34°15′54″N 117°56′06″W / 34.26500°N 117.93500°W