Chesterfield (UK Parliament constituency)
| Chesterfield | |
|---|---|
|
Borough constituency for the House of Commons | |
|
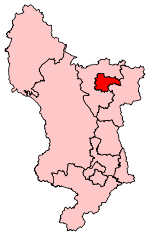
Boundary of Chesterfield in Derbyshire for the 2010 general election. | |
|
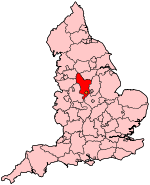
Location of Derbyshire within England. | |
| County | Derbyshire |
| Population | 93,248 (2011 census)[1] |
| Electorate | 72,866 (December 2010)[2] |
| Major settlements | Chesterfield |
| Current constituency | |
| Created | 1885 |
| Member of parliament | Toby Perkins (Labour) |
| Number of members | One |
| Created from | Derbyshire East |
| Overlaps | |
| European Parliament constituency | East Midlands |
Chesterfield is a constituency[n 1] represented in the House of Commons of the UK Parliament since the 2010 general election by Toby Perkins of the Labour Party.[n 2]
Boundaries
The current boundaries include the town of Chesterfield, together with areas to the north towards Dronfield and to the east towards Bolsover, comprising the Borough of Chesterfield wards: Brimington North, Brimington South, Brockwell, Dunston, Hasland, Hollingwood and Inkersall, Holmebrook, Linacre, Loundsley Green, Middlecroft and Poolsbrook, Moor, Old Whittington, Rother, St Helen’s, St Leonard’s, Walton, and West.[3] The other two Borough of Chesterfield wards (Barrow Hill and New Whittington; Lowgates and Woodthorpe) fall within the neighbouring North East Derbyshire seat.[3] Boundary changes before the 2010 general election, when the Mid Derbyshire constituency was created, meant that Chesterfield lost New Whittington to North East Derbyshire but otherwise retained its shape.
The town of Chesterfield lies just outside the Peak District southwest of Sheffield. Its best known landmark is the Church of St Mary and All Saints, commonly known as the 'Crooked Spire'. The constituency borders the constituencies of Bolsover and Derbyshire North East.
History
Chesterfield has mainly been a Labour seat with periods when it has been held by other parties, and was gained by the Liberal Democrats in 2001 and held by them until 2010. Chesterfield was a Labour Party safe seat from 1935 until 2001. Andrew Cavendish, later the Duke of Devonshire, was the National Liberal candidate at the 1945 and 1950 elections.
The seat was held in succession by two prominent Labour politicians for over 35 years. The former Labour cabinet minister Eric Varley held the seat from October 1964 to January 1984 and was succeeded by his ex-government colleague Tony Benn, who held the seat following a by-election in March 1984 and remained the town's MP until his retirement in 2001 to "spend more time involved in politics." Benn had been a Labour Cabinet Minister between 1966–70 and 1974-1979. while Varley was in the Wilson and Callaghan cabinets in the later period. Paul Holmes gained the seat for the Liberal Democrats at the 2001 general election, the party's first seat in the East Midlands in the House of Commons, but narrowly lost the seat in 2010 to the Labour candidate Toby Perkins; one of only three seats the Labour Party gained in the 2010 election. In 2015, a collapse in the Liberal Democrat vote had them fall to fourth place and the Conservatives moving into second, with Labour having their largest majority in the seat since 1979.
Members of Parliament
Election results
Elections in the 2010s
| Party | Candidate | Votes | % | ± | |
|---|---|---|---|---|---|
| Labour | Toby Perkins | 21,829 | 47.9 | +8.9 | |
| Conservative | Mark Vivis | 8,231 | 18.1 | +2.3 | |
| UKIP | Stuart Yeowart[8] | 7,523 | 16.5 | +13.4 | |
| Liberal Democrat | Julia Cambridge[9] | 6,301 | 13.8 | -24 | |
| Green | Matthew Genn[10] | 1,352 | 3 | +1.7 | |
| TUSC | Matt Whale[11] | 202 | 0.4 | +0.4 | |
| Peace | Tommy Holgate[12] | 129 | 0.3 | +0.3 | |
| Majority | 13,598 | 29.8 | +28.6 | ||
| Turnout | 45,567 | 63.2 | -0.6 | ||
| Labour hold | Swing | +3.3 | |||
At the 2015 general election, this seat was the 25th most marginal constituency in Great Britain, the Liberal Democrats requiring a swing from Labour of 0.6% to take the seat (based on the result of the 2010 general election).[13]
| Party | Candidate | Votes | % | ± | |
|---|---|---|---|---|---|
| Labour | Toby Perkins | 17,891 | 39.0 | -1.6 | |
| Liberal Democrat | Paul Holmes | 17,342 | 37.8 | -9.1 | |
| Conservative | Carolyn Abbott | 7,214 | 15.7 | +7.5 | |
| UKIP | David Phillips | 1,432 | 3.1 | +0.9 | |
| English Democrat | Ian Jerram | 1,213 | 2.6 | +0.8 | |
| Green | Duncan Kerr | 600 | 1.3 | N/A | |
| Independent | John "Noneoftheabove" Daramy | 147 | 0.3 | N/A | |
| Majority | 549 | 1.2 | N/A | ||
| Turnout | 45,839 | 63.8 | +3.8 | ||
| Labour gain from Liberal Democrat | Swing | +3.8 | |||
Elections in the 2000s
| Party | Candidate | Votes | % | ± | |
|---|---|---|---|---|---|
| Liberal Democrat | Paul Holmes | 20,875 | 47.3 | -0.5 | |
| Labour | Simon Rich | 17,830 | 40.4 | -1.6 | |
| Conservative | Mark Kreling | 3,605 | 8.2 | +0.1 | |
| UKIP | Christopher Brady | 997 | 2.3 | N/A | |
| English Democrat | Ian Jerram | 814 | 1.8 | N/A | |
| Majority | 3,045 | 6.9 | +1.1 | ||
| Turnout | 44,121 | 59.6 | -1.1 | ||
| Liberal Democrat hold | Swing | +0.6 | |||
| Party | Candidate | Votes | % | ± | |
|---|---|---|---|---|---|
| Liberal Democrat | Paul Holmes | 21,249 | 47.8 | +8.3 | |
| Labour | Reg Race | 18,663 | 42.0 | -8.8 | |
| Conservative | Simon Hitchcock | 3,613 | 8.1 | -1.1 | |
| Socialist Alliance | Jeannie Robinson | 437 | 1.0 | N/A | |
| Socialist Labour | Bill Harrison | 295 | 0.7 | N/A | |
| Independent | Christopher Rawson | 184 | 0.4 | N/A | |
| Majority | 2,586 | 5.8 | N/A | ||
| Turnout | 44,441 | 60.7 | -10.2 | ||
| Liberal Democrat gain from Labour | Swing | +8.6 | |||
Elections in the 1990s
| Party | Candidate | Votes | % | ± | |
|---|---|---|---|---|---|
| Labour | Tony Benn | 26,105 | 50.8 | +3.5 | |
| Liberal Democrat | Anthony Hugh Rogers | 20,330 | 39.6 | +3.8 | |
| Conservative | Martin Potter | 4,752 | 9.2 | -7.7 | |
| Independent | Norman Scarth | 202 | 0.4 | N/A | |
| Majority | 5,775 | 11.2 | -0.3 | ||
| Turnout | 51,389 | 78.0 | -0.1 | ||
| Labour hold | Swing | ||||
| Party | Candidate | Votes | % | ± | |
|---|---|---|---|---|---|
| Labour | Tony Benn | 26,461 | 47.3 | +1.8 | |
| Liberal Democrat | Anthony Hugh Rogers | 20,047 | 35.8 | +6.2 | |
| Conservative | PG Lewis | 9,473 | 16.9 | -8.0 | |
| Majority | 6,414 | 11.5 | -4.4 | ||
| Turnout | 55,981 | 78.1 | +1.4 | ||
| Labour hold | Swing | ||||
Elections in the 1980s
| Party | Candidate | Votes | % | ± | |
|---|---|---|---|---|---|
| Labour | Tony Benn | 24,532 | 44.9 | -1.6 | |
| Liberal | Anthony Hugh Rogers | 15,955 | 29.6 | -5.1 | |
| Conservative | Ronald Peter Grant | 13,472 | 25.0 | +9.8 | |
| Majority | 8,577 | 15.9 | +4.1 | ||
| Turnout | 53,959 | 76.7 | -0.2 | ||
| Labour hold | Swing | ||||
| Party | Candidate | Votes | % | ± | |
|---|---|---|---|---|---|
| Labour | Tony Benn | 24,633 | 46.5 | -1.6 | |
| Liberal | Max Payne | 18,369 | 34.7 | +15.1 | |
| Conservative | Nick Bourne | 8,028 | 15.2 | -17.3 | |
| Independent | Bill Maynard | 1,355 | 2.6 | N/A | |
| Monster Raving Loony | Screaming Lord Sutch | 178 | 0.3 | N/A | |
| Independent | David Bentley | 116 | 0.2 | N/A | |
| Independent | John Davey | 83 | 0.2 | N/A | |
| Independent | Thomas Layton | 46 | 0.1 | N/A | |
| Independent | Helen Anscombe | 34 | 0.1 | N/A | |
| Independent | Jitendra Bardwaj | 33 | 0.1 | N/A | |
| Independent | Donald Butler | 24 | 0.1 | N/A | |
| Independent | Paul Nicholls-Jones | 22 | 0.0 | N/A | |
| Independent | Sid Shaw | 20 | 0.0 | N/A | |
| Independent | Christopher Hill | 17 | 0.0 | N/A | |
| Independent | Giancarlo Piccaro | 15 | 0.0 | N/A | |
| Independent | David Cahill | 12 | 0.0 | N/A | |
| Independent | John Connell | 7 | 0.0 | N/A | |
| Majority | 6,264 | 11.8 | -3.8 | ||
| Turnout | 52,992 | 76.9 | +4.3 | ||
| Labour hold | Swing | ||||
| Party | Candidate | Votes | % | ± | |
|---|---|---|---|---|---|
| Labour | Eric Varley | 23,881 | 48.1 | -9.3 | |
| Conservative | Nick Bourne | 16,118 | 32.4 | +0.2 | |
| Liberal Democrat | Max Payne | 9,705 | 19.5 | +9.1 | |
| Majority | 7,763 | 15.6 | -9.5 | ||
| Turnout | 49,704 | 72.6 | -0.8 | ||
| Labour hold | Swing | ||||
Elections in the 1970s
| Party | Candidate | Votes | % | ± | |
|---|---|---|---|---|---|
| Labour | Eric Varley | 31,049 | 57.4 | ||
| Conservative | S. Hill | 17,445 | 32.2 | ||
| Liberal | M. Payne | 5,617 | 10.4 | ||
| Majority | 13,604 | 25.1 | |||
| Turnout | 73.4 | ||||
| Labour hold | Swing | ||||
| Party | Candidate | Votes | % | ± | |
|---|---|---|---|---|---|
| Labour | Eric Varley | 30,953 | 59.9 | ||
| Conservative | J. D. Taylor | 13,393 | 25.9 | ||
| Liberal | M. W. Brown | 7,349 | 14.2 | ||
| Majority | 17,560 | 34.0 | |||
| Turnout | 72.6 | ||||
| Labour hold | Swing | ||||
| Party | Candidate | Votes | % | ± | |
|---|---|---|---|---|---|
| Labour | Eric Varley | 31,040 | 54.8 | ||
| Conservative | J. D. Taylor | 15,644 | 27.6 | ||
| Liberal | M. W. Brown | 9,937 | 17.6 | ||
| Majority | 15,396 | 27.2 | |||
| Turnout | 80.1 | ||||
| Labour hold | Swing | ||||
| Party | Candidate | Votes | % | ± | |
|---|---|---|---|---|---|
| Labour | Eric Varley | 30,386 | 59.0 | ||
| Conservative | John C Ramsden | 16,217 | 31.5 | ||
| Liberal | Terence D Bamford | 4,891 | 9.5 | ||
| Majority | 14,169 | 27.5 | |||
| Turnout | 72.4 | ||||
| Labour hold | Swing | ||||
Elections in the 1960s
| Party | Candidate | Votes | % | ± | |
|---|---|---|---|---|---|
| Labour | Eric Varley | 31,542 | 61.6 | ||
| Conservative | Alan T Hale | 13,443 | 26.3 | ||
| Liberal | Terence D. Bamford | 6,227 | 12.2 | ||
| Majority | 18,099 | 35.3 | |||
| Turnout | 76.7 | ||||
| Labour hold | Swing | ||||
| Party | Candidate | Votes | % | ± | |
|---|---|---|---|---|---|
| Labour | Eric Varley | 29,452 | 56.5 | ||
| Conservative | William G Blake | 14,944 | 28.7 | ||
| Liberal | Derek A McKie | 7,738 | 14.8 | ||
| Majority | 14,508 | 27.8 | |||
| Turnout | 78.8 | ||||
| Labour hold | Swing | ||||
Elections in the 1950s
| Party | Candidate | Votes | % | ± | |
|---|---|---|---|---|---|
| Labour | George Benson | 30,534 | 56.6 | ||
| National Liberal | James Anthony Lemkin | 17,084 | 31.7 | ||
| Liberal | Geoffrey R. Smedley-Stevenson | 6,360 | 11.8 | ||
| Majority | 13,450 | 24.9 | |||
| Turnout | 82.7 | ||||
| Labour hold | Swing | ||||
| Party | Candidate | Votes | % | ± | |
|---|---|---|---|---|---|
| Labour | George Benson | 29,602 | 57.7 | ||
| National Liberal | Frank Hadfield | 21,748 | 42.4 | ||
| Majority | 7,854 | 15.3 | |||
| Turnout | 79.9 | ||||
| Labour hold | Swing | ||||
| Party | Candidate | Votes | % | ± | |
|---|---|---|---|---|---|
| Labour | George Benson | 34,753 | 63.7 | ||
| National Liberal | John F. Nash | 19,776 | 36.3 | ||
| Majority | 14,977 | 27.5 | |||
| Turnout | 84.2 | ||||
| Labour hold | Swing | ||||
| Party | Candidate | Votes | % | ± | |
|---|---|---|---|---|---|
| Labour | George Benson | 33,914 | 60.8 | ||
| National Liberal | Andrew Cavendish | 17,231 | 30.9 | ||
| Liberal | John William O'Neill | 4,052 | 7.3 | ||
| Communist | B. Barker | 554 | 1.0 | ||
| Majority | 16,683 | 29.9 | |||
| Turnout | 87.0 | ||||
| Labour hold | Swing | ||||
Elections in the 1940s
| Party | Candidate | Votes | % | ± | |
|---|---|---|---|---|---|
| Labour | George Benson | 29,459 | 62.8 | ||
| Liberal National | Marquess of Hartington | 17,424 | 37.2 | ||
| Majority | 12,035 | 25.7 | |||
| Turnout | 46,883 | 77.4 | |||
| Labour hold | Swing | ||||
General Election 1939/40:
Another general election was required to take place before the end of 1940. The political parties had been making preparations for an election to take place from 1939 and by the end of this year, the following candidates had been selected; *Labour: George Benson,
- Conservative:
Elections in the 1930s
| Party | Candidate | Votes | % | ± | |
|---|---|---|---|---|---|
| Labour | George Benson | 21,439 | 50.94 | ||
| Conservative | Roger John Edward Conant | 16,555 | 39.33 | ||
| Liberal | Robert George Hill | 4,096 | 9.73 | ||
| Majority | 4,884 | 11.60 | |||
| Turnout | 79.78 | ||||
| Labour gain from Conservative | Swing | ||||
| Party | Candidate | Votes | % | ± | |
|---|---|---|---|---|---|
| Conservative | Roger John Edward Conant | 23,026 | 57.46 | ||
| Labour | George Benson | 17,046 | 42.54 | ||
| Majority | 5,980 | 14.92 | |||
| Turnout | 80.02 | ||||
| Conservative gain from Labour | Swing | ||||
Elections in the 1920s
| Party | Candidate | Votes | % | ± | |
|---|---|---|---|---|---|
| Labour | George Benson | 20,296 | 54.1 | +14.4 | |
| Unionist | Roger John Edward Conant | 9,915 | 26.4 | n/a | |
| Liberal | Harry Cropper | 7,329 | 19.5 | -40.8 | |
| Majority | 10,381 | 27.7 | 48.3 | ||
| Turnout | 37,540 | 77.8 | +13.4 | ||
| Labour gain from Liberal | Swing | ||||
| Party | Candidate | Votes | % | ± | |
|---|---|---|---|---|---|
| Liberal | Barnet Kenyon | 13,971 | 60.3 | +9.4 | |
| Labour | George Benson | 9,206 | 39.7 | +13.8 | |
| Majority | |||||
| Turnout | 23,177 | 64.4 | |||
| Liberal hold | Swing | ||||

| Party | Candidate | Votes | % | ± | |
|---|---|---|---|---|---|
| Liberal | Barnet Kenyon | 12,164 | 50.9 | n/a | |
| Labour | George Benson | 6,198 | 25.9 | n/a | |
| Unionist | R F H Broomhead-Colton-Fox | 5,541 | 23.2 | n/a | |
| Majority | 5,966 | 25.0 | n/a | ||
| Turnout | 23,903 | n/a | |||
| Liberal hold | Swing | n/a | |||
Elections in the 1910s
| Party | Candidate | Votes | % | ± | |
|---|---|---|---|---|---|
| Liberal | Barnet Kenyon | unopposed | n/a | n/a | |
| Liberal hold | Swing | n/a | |||

| Party | Candidate | Votes | % | ± | |
|---|---|---|---|---|---|
| Liberal | Barnet Kenyon | 7,725 | 55.8 | ||
| Unionist | Edward Christie | 5,539 | 40.0 | ||
| Independent Labour | John Scurr | 583 | 4.2 | ||
| Turnout | 81.5 | ||||
| Majority | 2,186 | 15.8 | |||
| Liberal gain from Labour | Swing | ||||
See also
Notes and references
- Notes
- ↑ A borough constituency (for the purposes of election expenses and type of returning officer)
- ↑ As with all constituencies, the constituency elects one Member of Parliament (MP) by the first past the post system of election at least every five years.
- References
Craig, F. W. S. (1983). British parliamentary election results 1918-1949 (3 ed.). Chichester: Parliamentary Research Services. ISBN 0-900178-06-X.
- ↑ "Chesterfield: Usual Resident Population, 2011". Neighbourhood Statistics. Office for National Statistics. Retrieved 23 February 2015.
- ↑ "Electorate Figures - Boundary Commission for England". 2011 Electorate Figures. Boundary Commission for England. 4 March 2011. Archived from the original on 6 November 2010. Retrieved 13 March 2011.
- 1 2 "The Parliamentary Constituencies (England) Order 2007". legislation.gov.uk. IN DERBYSHIRE AND DERBY: The National Archives. p. 29. Retrieved 23 February 2015.
- ↑ "Chesterfield 1885-". Hansard 1803-2005. UK Parliament. Retrieved 2 February 2015.
- ↑ Leigh Rayment's Historical List of MPs – Constituencies beginning with "C" (part 3)
- ↑ "Election Data 2015". Electoral Calculus. Archived from the original on 17 October 2015. Retrieved 17 October 2015.
- ↑ Chesterfield parliamentary constituency BBC
- ↑ https://twitter.com/stuyog/status/564927453525991424
- ↑ http://electionresults.blogspot.co.uk/2013/04/chesterfield-2015.html
- ↑ http://derbyshiregreenparty.org.uk/elections/
- ↑ http://www.tusc.org.uk/txt/328.pdf
- ↑ "Peace Party". Retrieved 1 February 2015.
- ↑ Ransome Mpini; Charlotte Thornton; John Walton; Marcelo Zanni (24 February 2014). "Election 2015: The political battleground". BBC News. Retrieved 29 January 2015.
- ↑ "Election Data 2010". Electoral Calculus. Archived from the original on 17 October 2015. Retrieved 17 October 2015.
- ↑ "Election Data 2005". Electoral Calculus. Archived from the original on 15 October 2011. Retrieved 18 October 2015.
- ↑ "Election Data 2001". Electoral Calculus. Archived from the original on 15 October 2011. Retrieved 18 October 2015.
- ↑ "Election Data 1997". Electoral Calculus. Archived from the original on 15 October 2011. Retrieved 18 October 2015.
- ↑ "Election Data 1992". Electoral Calculus. Archived from the original on 15 October 2011. Retrieved 18 October 2015.
- ↑ "Election Data 1987". Electoral Calculus. Archived from the original on 15 October 2011. Retrieved 18 October 2015.
- ↑ "Election Data 1983". Electoral Calculus. Archived from the original on 15 October 2011. Retrieved 18 October 2015.
- Sources
- Guardian Unlimited Politics (Election results from 1992 to the present)
- http://www.psr.keele.ac.uk/ (Election results from 1951 to the present)
External links
- nomis Constituency Profile for Chesterfield — presenting data from the ONS annual population survey and other official statistics.
Coordinates: 53°15′N 1°24′W / 53.25°N 1.40°W