Climate of South Carolina
South Carolina has a humid subtropical climate, with hot summers and mild winters. On average, between 40 inches (1,000 mm) and 80 inches (2,000 mm) of precipitation falls annually across the state. Tropical cyclones, and afternoon thunderstorms due to hot and humid conditions, contribute to precipitation during the summer and sometimes fall months, while extratropical cyclones contribute to precipitation during the fall, winter, and spring months. Tornadoes happen mostly in the spring with a secondary peak in November. Hail and damaging winds often occur in summertime thunderstorms. Tornadoes are very uncommon in the summer unless a tropical cyclone is present.
Temperatures
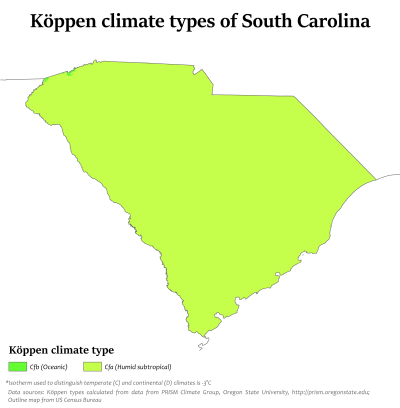
South Carolina has a humid subtropical climate (Köppen climate classification Cfa), although high elevation areas in the "Upstate" area have less subtropical characteristics than areas on the Atlantic coastline. In the summer, South Carolina is hot and humid with temperatures during the day averaging near 90 °F (32 °C) across most of the state with overnight lows near 90 °F (32 °C). Winter temperatures are much less uniform. Coastal areas of the state have very mild winters with high temperatures averaging about 60 °F (16 °C) and overnight lows close to 38 °F (3 °C). Further inland in the Piedmont, temperatures average between 50 °F (10 °C) during the day and 32 °F (0 °C) at night.
| Monthly normals and extremes for various South Carolina cities | ||||||||||||||||||||||||||||||||||||||||||||||||||||||||||||||||||||||||||||||||||||||||||||||||||||||||||||||||||||||||||||||||||||||||||||||||||||||||||||||||||||||||||||||||||||||||||||||||||||||||||||||||||||||||||||||||||||||||||||||||||||||||||||||||||||||||||||||||||||||||||||||||||||||||||||||||||||||||||||||||||||||||||||||||||||||||||||||||||||||||||||||||||||||||||
|---|---|---|---|---|---|---|---|---|---|---|---|---|---|---|---|---|---|---|---|---|---|---|---|---|---|---|---|---|---|---|---|---|---|---|---|---|---|---|---|---|---|---|---|---|---|---|---|---|---|---|---|---|---|---|---|---|---|---|---|---|---|---|---|---|---|---|---|---|---|---|---|---|---|---|---|---|---|---|---|---|---|---|---|---|---|---|---|---|---|---|---|---|---|---|---|---|---|---|---|---|---|---|---|---|---|---|---|---|---|---|---|---|---|---|---|---|---|---|---|---|---|---|---|---|---|---|---|---|---|---|---|---|---|---|---|---|---|---|---|---|---|---|---|---|---|---|---|---|---|---|---|---|---|---|---|---|---|---|---|---|---|---|---|---|---|---|---|---|---|---|---|---|---|---|---|---|---|---|---|---|---|---|---|---|---|---|---|---|---|---|---|---|---|---|---|---|---|---|---|---|---|---|---|---|---|---|---|---|---|---|---|---|---|---|---|---|---|---|---|---|---|---|---|---|---|---|---|---|---|---|---|---|---|---|---|---|---|---|---|---|---|---|---|---|---|---|---|---|---|---|---|---|---|---|---|---|---|---|---|---|---|---|---|---|---|---|---|---|---|---|---|---|---|---|---|---|---|---|---|---|---|---|---|---|---|---|---|---|---|---|---|---|---|---|---|---|---|---|---|---|---|---|---|---|---|---|---|---|---|---|---|---|---|---|---|---|---|---|---|---|---|---|---|---|---|---|---|---|---|---|---|---|---|---|---|---|---|---|---|---|---|---|---|---|---|---|---|---|---|---|---|---|---|---|---|---|---|---|---|---|---|---|---|---|---|---|---|---|---|---|---|---|---|---|---|---|---|---|
Greenville
| ||||||||||||||||||||||||||||||||||||||||||||||||||||||||||||||||||||||||||||||||||||||||||||||||||||||||||||||||||||||||||||||||||||||||||||||||||||||||||||||||||||||||||||||||||||||||||||||||||||||||||||||||||||||||||||||||||||||||||||||||||||||||||||||||||||||||||||||||||||||||||||||||||||||||||||||||||||||||||||||||||||||||||||||||||||||||||||||||||||||||||||||||||||||||||
Columbia
| ||||||||||||||||||||||||||||||||||||||||||||||||||||||||||||||||||||||||||||||||||||||||||||||||||||||||||||||||||||||||||||||||||||||||||||||||||||||||||||||||||||||||||||||||||||||||||||||||||||||||||||||||||||||||||||||||||||||||||||||||||||||||||||||||||||||||||||||||||||||||||||||||||||||||||||||||||||||||||||||||||||||||||||||||||||||||||||||||||||||||||||||||||||||||||
Charleston
| ||||||||||||||||||||||||||||||||||||||||||||||||||||||||||||||||||||||||||||||||||||||||||||||||||||||||||||||||||||||||||||||||||||||||||||||||||||||||||||||||||||||||||||||||||||||||||||||||||||||||||||||||||||||||||||||||||||||||||||||||||||||||||||||||||||||||||||||||||||||||||||||||||||||||||||||||||||||||||||||||||||||||||||||||||||||||||||||||||||||||||||||||||||||||||
Precipitation
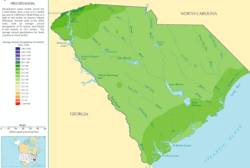
While precipitation is abundant the entire year in almost the entire state, the coastline tends to have a slightly wetter summer, while inland March tends to be the wettest month. During the cold season, extratropical cyclones is the main cause of precipitation, while during the summer, tropical cyclones and thunderstorms forming due to afternoon heating are the main causes of precipitation. A lee side rain shadow from the Appalachian Mountains lowers annual precipitation across central portions of the state.[12] Inland sections average 40 inches (1,000 mm) to 50 inches (1,300 mm) of rainfall, while near the coast 50 inches (1,300 mm) to 60 inches (1,500 mm), and the Piedmont receives 70 inches (1,800 mm) to 80 inches (2,000 mm) of precipitation.[13] Winter precipitation is determined in large by the El Niño-Southern Oscillation. During El Niño events, the jet stream is further south and east across the U.S., thus leading to cooler and wetter winters in South Carolina, while La Niña keeps the jet stream further north and west causing warmer and drier winters.
Snowfall and ice
Annual snowfall across inland South Carolina is very small, and in coastal areas several years might pass without any measurable snowfall. The snowiest location in the state averages 12 inches (30 cm) of snow a year in the Blue Ridge Mountains of the state. Freezing rain is more common than snow and even rain across much of the state in the winter months. Along the coast snowfall is very rare, with only a few snow events on record. Charleston averages less than 1 inch annually, and often 5 to 10 years might pass without any snowfall.
Tropical cyclones
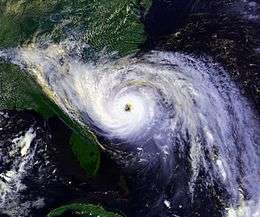
The state is prone to tropical cyclones. This is an annual concern during hurricane season, which is from June through November. The peak time of vulnerability for the southeast Atlantic coast is from early August to early October when tropical cyclone frequency is highest.[14] Major hurricanes can impact the Palmetto state, though there are no category 5 impacts on record.[15] Two of the stronger hurricanes to strike South Carolina in recent times are Hurricane Hazel (1954) and Hurricane Hugo (1989), which were of category 4 strength. For weaker systems, rainfall and spin-up tornadoes in the outer bands are the main impacts to the state. The wettest known tropical cyclone to impact South Carolina was a tropical depression named Jerry in 1995 which stalled nearby and had previously been a tropical storm across Florida.[16]
Thunderstorms and tornadoes
South Carolina averages around 64 days of thunderstorm activity per year. Most thunderstorms occur during the summer. South Carolina is vulnerable to tornadoes. Some notable tornadoes have struck South Carolina and the state averages around 14 tornadoes annually.[17] There have been no F-5 tornadoes on record but over a dozen F-4 tornadoes have occurred in many counties in South Carolina.
See also
- Climate of the United States
- List of wettest tropical cyclones in South Carolina
- United States rainfall climatology
- List of South Carolina weather records
Notes
- ↑ Mean monthly maxima and minima (i.e. the expected highest and lowest temperature readings at any point during the year or given month) calculated based on data at said location from 1981 to 2010.
- ↑ Official records for Greenville kept April 1884 to 10 December 1941 at downtown, 11 December 1941 to 14 October 1962 at Greenville Downtown Airport, and at Greenville–Spartanburg Int'l near Greer since 15 October 1962. For more information, see Threadex
- ↑ Mean monthly maxima and minima (i.e. the expected highest and lowest temperature readings at any point during the year or given month) calculated based on data at said location from 1981 to 2010.
- ↑ Official records for Columbia were kept at downtown from June 1887 to December 1947, and at Columbia Airport since January 1948. For more information, see Threadex
References
- ↑ "NowData - NOAA Online Weather Data". National Oceanic and Atmospheric Administration. Retrieved 2016-09-04.
- ↑ "Station Name: SC GREER". National Oceanic and Atmospheric Administration. Retrieved 2016-09-04.
- ↑ "WMO Climate Normals for GREENVILLE/G-SPARTANBURG, SC 1961–1990". National Oceanic and Atmospheric Administration. Retrieved 2016-09-04.
- ↑ "NowData – NOAA Online Weather Data". National Oceanic and Atmospheric Administration. Retrieved 2016-09-04.
- ↑ "Station Name: SC COLUMBIA". National Oceanic and Atmospheric Administration. Retrieved 2016-09-04.
- ↑ "WMO Climate Normals for COLUMBIA/METRO ARPT SC 1961–1990". National Oceanic and Atmospheric Administration. Retrieved 2016-09-04.
- 1 2 Mean monthly maxima and minima (i.e. the expected highest and lowest temperature readings at any point during the year or given month) calculated based on data at said location from 1981 to 2010.
- 1 2 "NowData - NOAA Online Weather Data". National Oceanic and Atmospheric Administration. Retrieved 2016-09-04.
- ↑ "Station Name: SC CHARLESTON INTL AP". National Oceanic and Atmospheric Administration. Retrieved 2014-05-09.
- ↑ "WMO Climate Normals for CHARLESTON/MUNICIPAL, SC 1961–1990". National Oceanic and Atmospheric Administration. Retrieved 2016-09-04.
- ↑ "Station Name: SC CHARLESTON CITY". National Oceanic and Atmospheric Administration. Retrieved 2014-05-09.
- ↑ South Carolina State Climatology Office. South Carolina Climate. Retrieved on 2008-03-18.
- ↑ National Atlas.gov. Average annual precipitation for South Carolina. Retrieved on 2008-03-08.
- ↑ National Hurricane Center. Graphic showing seasonal activity by date. Retrieved on 2008-03-18.
- ↑ Eric S. Blake, Edward N. Rappaport, and Chris Landsea. The Deadliest, Costliest, and Most Intense United States Tropical Cyclones From 1851 to 2006 (and other frequently requested hurricane facts).
- ↑ [[National Hurricane Center] ainblk.gif Tropical Storm Jerry Color-Filled Rainfall Graphic.] Retrieved on 2008-03-18.
- ↑ National Climatic Data Center. Annual average number of tornadoes. Retrieved on 2006-10-24.