Closing milestones of the Nasdaq Composite
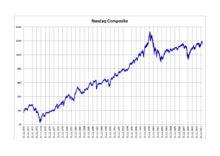
This article is a summary of the closing milestones of the Nasdaq Composite, a United States stock market index. Since first opening at 100.00 on February 5, 1971, the Nasdaq Composite has increased, despite several periods of decline, most recently after the financial crisis.
Milestone highs and lows
Incremental closing milestones
The following is a list of the milestone closing levels of the Nasdaq Composite. Threshold for milestones is as follows: 10-point increments are used up to the 500-point level; 20 to 1,000; 50 to 2,000; and 100-point increments thereafter. Additional milestones may be used if necessary.
The Early 1970s Bull Market (1971-1972)
| Milestone | Closing Level | Date First Achieved |
|---|---|---|
| 1001 | 100.00 | February 5, 1971 |
| 110 | 110.16 | April 19, 1971 |
| 120 | 120.47 | February 2, 1972 |
| 130 | 130.00 | April 5, 1972 |
The 1980s Bull Market (1978-1987)
| Milestone | Closing Level | Date First Achieved |
|---|---|---|
| 136.842 | 137.09 | September 7, 1978 |
| 140 | 140.02 | July 27, 1979 |
| 150 | 150.04 | August 29, 1979 |
| 160 | 160.70 | January 28, 1980 |
| 170 | 170.48 | July 21, 1980 |
| 180 | 181.70 | August 22, 1980 |
| 190 | 191.31 | September 16, 1980 |
| 200 | 200.25 | November 13, 1980 |
| 210 | 210.18 | March 31, 1981 |
| 220 | 220.24 | May 26, 1981 |
| 230 | 230.19 | November 9, 1982 |
| 240 | 240.65 | December 7, 1982 |
| 250 | 251.65 | February 4, 1983 |
| 260 | 261.29 | February 18, 1983 |
| 270 | 270.37 | March 24, 1983 |
| 280 | 281.60 | April 15, 1983 |
| 290 | 290.84 | April 28, 1983 |
| 300 | 301.64 | May 6, 1983 |
| 310 | 311.39 | May 26, 1983 |
| 320 | 320.04 | June 14, 1983 |
| 330 | 330.00 | January 16, 1986 |
| 340 | 340.80 | February 6, 1986 |
| 350 | 350.20 | February 14, 1986 |
| 360 | 362.00 | March 4, 1986 |
| 370 | 370.40 | March 13, 1986 |
| 380 | 380.80 | April 14, 1986 |
| 390 | 390.00 | April 17, 1986 |
| 400 | 400.20 | May 30, 1986 |
| 410 | 411.20 | July 3, 1986 |
| 420 | 421.00 | February 25, 1987 |
| 430 | 431.40 | March 11, 1987 |
| 440 | 440.80 | August 6, 1987 |
| 450 | 451.60 | August 13, 1987 |
The 1990s Acceleration Bull Market (1989-2000)
| Milestone | Closing Level | Date First Achieved |
|---|---|---|
| 455.803 | 456.90 | August 3, 1989 |
| 460 | 461.70 | August 7, 1989 |
| 470 | 471.30 | September 1, 1989 |
| 480 | 480.70 | October 5, 1989 |
| 490 | 491.20 | April 2, 1991 |
| 500 | 501.62 | April 12, 1991 |
| 520 | 521.06 | August 23, 1991 |
| 540 | 540.94 | October 16, 1991 |
| 560 | 565.71 | December 27, 1991 |
| 580 | 586.34 | December 31, 1991 |
| 600 | 602.29 | January 7, 1992 |
| 620 | 625.75 | January 14, 1992 |
| 640 | 644.92 | February 12, 1992 |
| 660 | 661.60 | December 4, 1992 |
| 680 | 681.85 | January 6, 1993 |
| 700 | 700.77 | January 21, 1993 |
| 720 | 726.89 | August 16, 1993 |
| 740 | 742.84 | August 31, 1993 |
| 760 | 763.66 | September 28, 1993 |
| 780 | 785.41 | October 14, 1993 |
| 800 | 800.47 | January 31, 1994 |
| 820 | 822.63 | March 27, 1995 |
| 840 | 840.95 | April 27, 1995 |
| 860 | 863.06 | May 15, 1995 |
| 880 | 882.85 | June 5, 1995 |
| 900 | 902.68 | June 15, 1995 |
| 920 | 922.09 | June 19, 1995 |
| 940 | 940.09 | June 22, 1995 |
| 960 | 969.76 | July 7, 1995 |
| 980 | 988.63 | July 12, 1995 |
| 1,000 | 1,005.89 | July 17, 1995 |
| 1,050 | 1,051.08 | September 7, 1995 |
| 1,100 | 1,117.11 | February 22, 1996 |
| 1,150 | 1,153.70 | April 22, 1996 |
| 1,200 | 1,202.76 | May 10, 1996 |
| 1,250 | 1,250.87 | October 7, 1996 |
| 1,300 | 1,300.37 | December 3, 1996 |
| 1,350 | 1,364.28 | January 20, 1997 |
| 1,400 | 1,409.21 | May 27, 1997 |
| 1,450 | 1,452.43 | June 24, 1997 |
| 1,500 | 1,502.62 | July 11, 1997 |
| 1,550 | 1,580.63 | July 16, 1997 |
| 1,600 | 1,605.45 | August 4, 1997 |
| 1,650 | 1,656.22 | September 9, 1997 |
| 1,700 | 1,702.41 | October 2, 1997 |
| 1,750 | 1,751.76 | February 23, 1998 |
| 1,800 | 1,812.44 | March 24, 1998 |
| 1,850 | 1,852.96 | April 2, 1998 |
| 1,900 | 1,903.87 | April 21, 1998 |
| 1,950 | 1,965.53 | July 13, 1998 |
| 2,000 | 2,000.56 | July 16, 1998 |
| 2,100 | 2,138.03 | December 21, 1998 |
| 2,200 | 2,208.05 | January 4, 1999 |
| 2,300 | 2,320.86 | January 6, 1999 |
| 2,400 | 2,408.17 | January 19, 1999 |
| 2,500 | 2,505.89 | January 29, 1999 |
| 2,600 | 2,652.05 | April 26, 1999 |
| 2,700 | 2,706.18 | July 1, 1999 |
| 2,800 | 2,818.13 | July 14, 1999 |
| 2,900 | 2,915.95 | October 11, 1999 |
| 3,000 | 3,028.51 | November 3, 1999 |
| 3,100 | 3,102.29 | November 5, 1999 |
| 3,200 | 3,221.15 | November 12, 1999 |
| 3,300 | 3,347.11 | November 18, 1999 |
| 3,400 | 3,420.50 | November 24, 1999 |
| 3,500 | 3,520.63 | December 3, 1999 |
| 3,600 | 3,620.24 | December 10, 1999 |
| 3,700 | 3,715.06 | December 16, 1999 |
| 3,800 | 3,911.15 | December 21, 1999 |
| 3,900 | ||
| 4,000 | 4,041.46 | December 29, 1999 |
| 4,100 | 4,131.15 | January 3, 2000 |
| 4,200 | 4,235.40 | January 21, 2000 |
| 4,300 | 4,321.77 | February 7, 2000 |
| 4,400 | 4,427.50 | February 8, 2000 |
| 4,500 | 4,548.92 | February 17, 2000 |
| 4,600 | 4,617.65 | February 24, 2000 |
| 4,700 | 4,784.08 | March 1, 2000 |
| 4,800 | 4,914.79 | March 3, 2000 |
| 4,900 | ||
| 5,000 | 5,046.86 | March 9, 2000 |
Do-Over of the Milestones (2002-2015)
| Before the Financial Crisis (2002-2007)
After reaching an intra-day low of 1,108.49 on October 10, 2002, the Nasdaq started to recover with a major setback in the Financial Crisis.
|
After the Financial Crisis (2011-2015)
After the Financial Crisis, the Nasdaq started another recovery that ultimately led to the all-time closing high set back in 2000.
|
The 2010s Cyclical Bull Market (2009-Present)
| Milestone | Closing Level | Date First Achieved |
|---|---|---|
| 5,048.624 | 5,056.06 | April 23, 2015 |
| 5,1006 | 5,106.59 | May 27, 2015 |
| 5,132.527 | 5,132.95 | June 18, 2015 |
| 5,200 | 5,210.14 | July 17, 2015 |
| 5,218.868 | 5,221.12 | August 5, 2016 |
| 5,300 | 5,339.52 | September 22, 2016 |
| 5,4009 | TBA | TBA |
| 5,500 | TBA | TBA |
| 5,600 | TBA | TBA |
| 5,700 | TBA | TBA |
| 5,800 | TBA | TBA |
| 5,900 | TBA | TBA |
| 6,000 | TBA | TBA |
Notes
1This was the Nasdaq's very first close on February 5, 1971.
2This was the Nasdaq's close at the peak on January 11, 1973.
3This was the Nasdaq's close at the peak on August 27, 1987.
4This was the Nasdaq's close at the peak on March 10, 2000.
5This was the Nasdaq's close at the peak on October 31, 2007.
6The Nasdaq first traded above 5,100 on March 10, 2000; however, it took over 15 years for the Nasdaq to finally close above 5,100.
7This was the Nasdaq's all-time intraday high on March 10, 2000, which was finally broken on June 18, 2015.
8This was the Nasdaq's close at the peak on July 20, 2015 before the 2015-16 stock market selloff.
8The Nasdaq first traded above 5,400 during the session on Tuesday, November 29, 2016, but dropped below before the closing.
Records
| Category | All-Time Highs | All-Time Lows | ||
|---|---|---|---|---|
| Closing | 5,398.92 | Friday, November 25, 2016 | 54.87 | Thursday, October 3, 1974 |
| Intraday | 5,403.86 | Tuesday, November 29, 2016 | 54.87 | Thursday, October 3, 1974 |
See also
- Closing milestones of the Dow Jones Industrial Average
- Closing milestones of the S&P 500 Index
- List of largest daily changes in the Nasdaq Composite
- Market trend
- Stock market bubble
- Stock market crash