Croydon North (UK Parliament constituency)
| Croydon North | |
|---|---|
|
Borough constituency for the House of Commons | |
|
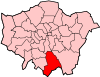
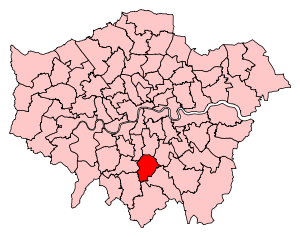
Boundary of Croydon North in Greater London. | |
| County | Greater London |
| Electorate | 85,107 (December 2010)[1] |
| Major settlements | Thornton Heath, Norbury, Selhurst, South Norwood, Upper Norwood |
| Current constituency | |
| Created | 1997 |
| Member of parliament | Steve Reed (Labour Party) |
| Number of members | One |
| Created from | Croydon North East and Croydon North West |
| 1918–1955 | |
| Number of members | One |
| Replaced by | Croydon North East and Croydon North West |
| Overlaps | |
| European Parliament constituency | London |
Croydon North is a constituency[n 1] represented in the House of Commons of the UK Parliament since 2012 by Steve Reed of the Labour Party.[n 2]
History
On re-creation at the 1997 general election the MP for the seat became Malcolm Wicks of the Labour Party with the fourth largest Labour majority in Greater London. Wicks was victorious at the next two general elections and died on 29 September 2012, prompting the 2012 Croydon North by-election which was won by Steve Reed, also of the Labour Party.
The seat was created from the former Croydon North West and part of the former North East constituencies. In its previous form it existed from 1918 until 1955.
Constituency profile
Croydon North is the densest of Croydon's three seats, regarded as safely Labour with all wards held safely by them at local level, consisting for the most part of rows of modest terraced houses, interspersed with tower blocks, much of it social and ex-social housing and with recreation areas.[2]
Passing through the constituency are London Overground and Southern services to London Victoria and Croydon — the seat is well connected by several stations to rail services. There has been some regeneration since 2000 with new-build developments for affluent commuters.[3]
The seat includes Crystal Palace FC's ground at Selhurst Park and the northeastern end of the seat is near the site of the former Crystal Palace itself.
Boundaries
1918-1950: The County Borough of Croydon wards of North, South Norwood, and Upper Norwood.
1950-1955: The County Borough of Croydon wards of Bensham Manor, Norbury, Thornton Heath, Upper Norwood, and West Thornton.
1997-2010: The London Borough of Croydon wards of Bensham Manor, Beulah, Broad Green, Norbury, South Norwood, Thornton Heath, Upper Norwood, West Thornton, and Whitehorse Manor.
2010–present: The London Borough of Croydon wards of Bensham Manor, Broad Green, Norbury, Selhurst, South Norwood, Thornton Heath, Upper Norwood, and West Thornton.
Members of Parliament
As Croydon North
| Election | Member | Party | Notes | |
|---|---|---|---|---|
| 1918 | George Borwick | Conservative | ||
| 1922 | Glyn Mason | Conservative | Resigned 1940 | |
| 1940 by-election | Henry Willink | Conservative | Resigned 1948 | |
| 1948 by-election | Fred Harris | Conservative | ||
| 1955 | constituency abolished: see Croydon North East & Croydon North West | |||
| 1997 | constituency re-created | |||
| 1997 | Malcolm Wicks | Labour | Died 2012 | |
| 2012 by-election | Steve Reed | Labour | ||
As Croydon North East
| Event | Member[4] | Party | |
|---|---|---|---|
| 1955 | John Hughes-Hallett | Conservative | |
| 1964 | Bernard Weatherill | Conservative | |
| 1983 | Speaker | ||
| 1992 | David Congdon | Conservative | |
As Croydon North West
Election results
Elections in the 2010s
| Party | Candidate | Votes | % | ± | |
|---|---|---|---|---|---|
| Labour Co-op | Steve Reed | 33,513 | 62.6 | +6.6 | |
| Conservative | Vidhi Mohan | 12,149 | 22.7 | -1.4 | |
| UKIP | Winston McKenzie | 2,899 | 5.4 | +3.7 | |
| Green | Shasha Khan | 2,515 | 4.7 | +2.7 | |
| Liberal Democrat | Joanna Corbin | 1,919 | 3.6 | -10.4 | |
| TUSC | Glen Hart | 261 | 0.5 | +0.5 | |
| Independent | Lee Berks | 141 | 0.3 | +0.3 | |
| Communist | Ben Stevenson | 125 | 0.2 | -0.1 | |
| Majority | 21,364 | 39.9 | -8 | ||
| Turnout | 53,522 | 62.3 | +35.77 | ||
| Labour hold | Swing | +4.0 | |||
| Party | Candidate | Votes | % | ± | |
|---|---|---|---|---|---|
| Labour | Steve Reed | 15,892 | 64.7 | +8.7 | |
| Conservative | Andrew Stranack | 4,137 | 16.8 | -7.3 | |
| UKIP | Winston McKenzie | 1,400 | 5.7 | +4.0 | |
| Liberal Democrat | Marisha Ray | 860 | 3.5 | -10.5 | |
| Green | Shasha Khan | 855 | 3.5 | +1.5 | |
| Respect | Lee Jasper | 707 | 2.9 | +2.4 | |
| Christian Peoples | Stephen Hammond | 192 | 0.8 | N/A | |
| National Front | Richard Edmonds | 161 | 0.7 | N/A | |
| Communist | Ben Stevenson | 119 | 0.5 | +0.2 | |
| Monster Raving Loony | John Cartwright | 110 | 0.4 | N/A | |
| Nine Eleven Was An Inside Job | Simon Lane | 66 | 0.3 | N/A | |
| Young People's Party | Robin Smith | 63 | 0.3 | N/A | |
| Majority | 11,755 | 47.9 | +16.0 | ||
| Rejected ballots | |||||
| Turnout | 26.53% | ||||
| Labour hold | Swing | ||||
| Party | Candidate | Votes | % | ± | |
|---|---|---|---|---|---|
| Labour | Malcolm Wicks | 28,947 | 56.0 | +2.4 | |
| Conservative | Jason Hadden | 12,466 | 24.1 | +1.9 | |
| Liberal Democrat | Gerry Jerome | 7,226 | 14.0 | −3.2 | |
| Green | Shasha Khan | 1,017 | 2.0 | −0.9 | |
| UKIP | Jonathan Serter | 891 | 1.7 | −0.0 | |
| Christian | Novlette Williams | 586 | 1.1 | N/A | |
| Respect | Mohommad Shaikh | 272 | 0.5 | N/A | |
| Communist | Ben Stevenson | 160 | 0.3 | N/A | |
| Independent | Mohamed Seyed | 111 | 0.2 | N/A | |
| Majority | 16,481 | 31.9 | +0.5 | ||
| Turnout | 51,676 | 60.6 | +8.0 | ||
| Labour hold | Swing | +0.3 | |||
Elections in the 2000s
| Party | Candidate | Votes | % | ± | |
|---|---|---|---|---|---|
| Labour | Malcolm Wicks | 23,555 | 53.7 | −9.8 | |
| Conservative | Tariq Ahmad | 9,667 | 22.0 | −1.3 | |
| Liberal Democrat | Adrian Gee-Turner | 7,590 | 17.2 | +6.8 | |
| Green | Shasha Khan | 1,248 | 2.8 | N/A | |
| UKIP | Henry Pearce | 770 | 1.8 | +0.4 | |
| Croydon Pensions Alliance | Peter Gibson | 394 | 0.9 | N/A | |
| Veritas | Winston McKenzie | 324 | 0.7 | N/A | |
| Independent | Farhan Rasheed | 197 | 0.4 | N/A | |
| The People's Choice! Exclusively For All | Michelle Chambers | 132 | 0.3 | N/A | |
| Majority | 13,888 | 31.7 | |||
| Turnout | 43,877 | 52.3 | −0.9 | ||
| Labour hold | Swing | −4.3 | |||
| Party | Candidate | Votes | % | ± | |
|---|---|---|---|---|---|
| Labour | Malcolm Wicks | 26,610 | 63.5 | +1.4 | |
| Conservative | Simon Allison | 9,752 | 23.3 | -3.9 | |
| Liberal Democrat | Sandra Lawman | 4,375 | 10.4 | +2.7 | |
| UKIP | Alan Smith | 606 | 1.4 | +0.7 | |
| Socialist Alliance | Don Madgwick | 539 | 1.3 | N/A | |
| Majority | 16,858 | 40.2 | |||
| Turnout | 41,882 | 53.2 | -15.0 | ||
| Labour hold | Swing | ||||
Election in the 1990s
| Party | Candidate | Votes | % | ± | |
|---|---|---|---|---|---|
| Labour | Malcolm Wicks | 32,672 | 62.2 | N/A | |
| Conservative | Ian Martin | 14,274 | 27.2 | N/A | |
| Liberal Democrat | Martin Morris | 4,066 | 7.7 | N/A | |
| Referendum | Roger Billis | 1,155 | 2.2 | N/A | |
| UKIP | James R. Feisenberger | 396 | 0.8 | N/A | |
| Majority | 18,398 | 35.0 | N/A | ||
| Turnout | 52,563 | 68.2 | N/A | ||
| Labour hold | Swing | ||||
Elections in the 1950s
| Party | Candidate | Votes | % | ± | |
|---|---|---|---|---|---|
| Conservative | Fred Harris | 29,984 | 55.5 | +2.1 | |
| Labour | Reginald Prentice | 19,738 | 36.6 | +0.1 | |
| Liberal | Brian Collins | 4,272 | 7.9 | -2.3 | |
| Majority | 10,246 | 19.0 | |||
| Turnout | 53,994 | ||||
| Conservative hold | Swing | +1.0 | |||
| Party | Candidate | Votes | % | ± | |
|---|---|---|---|---|---|
| Conservative | Fred Harris | 29,420 | 53.4 | ||
| Labour | Reginald Prentice | 20,116 | 36.5 | ||
| Liberal | F. O. H. Rowlands | 5,600 | 10.2 | ||
| Majority | 9,304 | 16.9 | |||
| Turnout | 55,136 | ||||
| Conservative hold | Swing | ||||
Elections in the 1940s
| Party | Candidate | Votes | % | ± | |
|---|---|---|---|---|---|
| Conservative | Fred Harris | 36,200 | 54.0 | +13.9 | |
| Labour | Hon. Harold Nicolson | 24,536 | 36.6 | -3.5 | |
| Liberal | Donald Bennett | 6,321 | 9.4 | -9.4 | |
| Majority | 11,664 | 17.4 | +16.3 | ||
| Turnout | 67,057 | ||||
| Conservative hold | Swing | +8.7 | |||
| Party | Candidate | Votes | % | ± | |
|---|---|---|---|---|---|
| Conservative | Henry Willink | 23,417 | 41.1 | -26.0 | |
| Labour | Marian Billson | 22,810 | 40.1 | +7.2 | |
| Liberal | John Howard | 10,714 | 18.8 | +18.8 | |
| Majority | 607 | 1.1 | -33.0 | ||
| Turnout | 56,941 | ||||
| Conservative hold | Swing | -16.6 v. 1935 |
|||
| Party | Candidate | Votes | % | ± | |
|---|---|---|---|---|---|
| Conservative | Henry Willink | 14,163 | 90.7 | N/A | |
| Independent | Arthur Lascelles Lucas | 1,445 | 9.3 | N/A | |
| Majority | 12,718 | 81.4 | N/A | ||
| Turnout | 15,608 | ||||
| Conservative hold | Swing | N/A | |||
Elections in the 1930s
| Party | Candidate | Votes | % | ± | |
|---|---|---|---|---|---|
| Conservative | Glyn Mason | 36,383 | 67.1 | -13.8 | |
| Labour | F. Mitchell | 17,872 | 32.9 | +13.8 | |
| Majority | 18,511 | 34.1 | -27.6 | ||
| Turnout | 54,255 | ||||
| Conservative hold | Swing | -13.8 | |||
| Party | Candidate | Votes | % | ± | |
|---|---|---|---|---|---|
| Conservative | Glyn Mason | 45,595 | 80.9 | +30.5 | |
| Labour | H. W. Ray | 10,795 | 19.1 | -7.4 | |
| Majority | 34,800 | 61.7 | +37.8 | ||
| Turnout | 56,490 | ||||
| Conservative hold | Swing | +19.0 | |||
Elections in the 1920s
| Party | Candidate | Votes | % | ± | |
|---|---|---|---|---|---|
| Unionist | Glyn Keith Murray Mason | 26,336 | 50.4 | -19.9 | |
| Labour | Gilbert Arthur Foan | 13,852 | 26.5 | -3.2 | |
| Liberal | Cyril Walter Nunneley | 12,053 | 23.1 | +23.1 | |
| Majority | 12,484 | 23.9 | -16.7 | ||
| Turnout | 52,241 | ||||
| Unionist hold | Swing | -8.3 | |||
| Party | Candidate | Votes | % | ± | |
|---|---|---|---|---|---|
| Unionist | Glyn Keith Murray Mason | 25,972 | 70.3 | ||
| Labour | Gilbert Arthur Foan | 10,954 | 29.7 | ||
| Majority | 15,018 | 40.7 | |||
| Turnout | 36,926 | ||||
| Unionist hold | Swing | ||||
| Party | Candidate | Votes | % | ± | |
|---|---|---|---|---|---|
| Unionist | Glyn Keith Murray Mason | 17,085 | 63.0 | n/a | |
| Labour | Gilbert Arthur Foan | 10,054 | 37.0 | n/a | |
| Majority | 7,031 | 26.0 | n/a | ||
| Turnout | 55.7 | n/a | |||
| Unionist hold | Swing | n/a | |||
See also
Notes and references
- Notes
- ↑ A borough constituency (for the purposes of election expenses and type of returning officer)
- ↑ As with all constituencies, the constituency elects one Member of Parliament (MP) by the first past the post system of election at least every five years
- References
- ↑ "Electorate Figures - Boundary Commission for England". 2011 Electorate Figures. Boundary Commission for England. 4 March 2011. Archived from the original on 6 November 2010. Retrieved 13 March 2011.
- ↑ Get a Map Ordnance survey
- ↑ Planning Applications Croydon Council
- ↑ Leigh Rayment's Historical List of MPs – Constituencies beginning with "C" (part 6)
- ↑ "Election Data 2015". Electoral Calculus. Archived from the original on 17 October 2015. Retrieved 17 October 2015.
- ↑ https://www.croydon.gov.uk/sites/default/files/articles/downloads/Croydon-North-election-results.pdf 19Aug15
- ↑ Election 2015 - Croydon North BBC News, 8 May 2015
- ↑ Croydon North by-election: Labour's Steve Reed secures win BBC News, 30 November 2012
- ↑ Parliamentary election results 2010, Croydon North Croydon Council
- ↑ UK general election 2005 - Results for Croydon North Electoral Commission
- ↑ British Parliamentary Election Results 1918-1949, FWS Craig