Demographics of Arizona
| Historical population | |||
|---|---|---|---|
| Census | Pop. | %± | |
| 1870 | 9,658 | — | |
| 1880 | 40,440 | 318.7% | |
| 1890 | 88,243 | 118.2% | |
| 1900 | 122,931 | 39.3% | |
| 1910 | 204,354 | 66.2% | |
| 1920 | 334,162 | 63.5% | |
| 1930 | 435,573 | 30.3% | |
| 1940 | 499,261 | 14.6% | |
| 1950 | 749,587 | 50.1% | |
| 1960 | 1,302,161 | 73.7% | |
| 1970 | 1,745,944 | 34.1% | |
| 1980 | 2,718,215 | 55.7% | |
| 1990 | 3,665,228 | 34.8% | |
| 2000 | 5,130,632 | 40.0% | |
| 2010 | 6,392,017 | 24.6% | |
| Sources: 1910–2010.[1] Note that early censuses may not include Native Americans in Arizona. | |||
As of 2009, Arizona had a population of 6.343 million,[2] which is an increase of 213,311, or 3.6%, from the prior year and an increase of 1,035,686, or 20.2%, since the year 2000. This includes a natural increase since the last census of 297,928 people (that is 564,062 births minus 266,134 deaths) and an increase due to net migration of 745,944 people into the state. Immigration from outside the United States resulted in a net increase of 204,661 people, and migration within the country produced a net increase of 541,283 people. New population figures for the year ending July 1, 2006, indicate that Arizona is the fastest growing state in the United States, with 3.6% population growth since 2005, exceeding the growth of the previous leader, Nevada. The most recent population estimates released by the US Census put the population at 6,828,065 in 2015.[3]
The population density of the state is 45.2 people per square mile.[4] In 2010, there were an estimated 460,000 illegal immigrants in the state.[5] These constituted an estimated 7.9% of the population.[6]
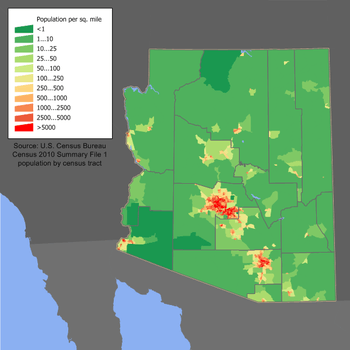
The center of population of Arizona is located in Maricopa County,[7] which contains over 61% of Arizona's population.[8]
Race and ethnicity
| By race | White | Black | AIAN* | Asian | NHPI* |
|---|---|---|---|---|---|
| 2000 (total population) | 89.29% | 3.74% | 5.81% | 2.36% | 0.28% |
| 2000 (Hispanic only) | 24.13% | 0.41% | 0.73% | 0.19% | 0.07% |
| 2005 (total population) | 88.74% | 4.20% | 5.63% | 2.75% | 0.31% |
| 2005 (Hispanic only) | 27.20% | 0.58% | 0.72% | 0.23% | 0.08% |
| Growth 2000–05 (total population) | 15.05% | 30.11% | 12.25% | 35.27% | 25.02% |
| Growth 2000–05 (non-Hispanic only) | 9.32% | 25.75% | 11.85% | 34.75% | 22.33% |
| Growth 2000–05 (Hispanic only) | 30.51% | 65.92% | 15.01% | 41.10% | 32.89% |
| * AIAN is American Indian or Alaskan Native; NHPI is Native Hawaiian or Pacific Islander | |||||
According to the 2005–2007 American Community Survey conducted by the U.S. Census Bureau, White Americans made up 76.4% of Arizona's population; of which 59.6% were Non-Hispanic Whites. Blacks or African Americans made up 3.4% of Arizona's population; of which 3.3% were non-Hispanic blacks. American Indians made up 4.5% of the state's population; of which 4.1% were non-Hispanic. Asian Americans made up 2.3% of the state's population. Pacific Islander Americans made up 0.1% of the state's population. Individuals from some other race made up 10.8% of the state's population; of which 0.2% were non-Hispanic. Individuals from two or more races made up 2.4% of the state's population; of which 1.4% were non-Hispanic. In addition, Hispanics and Latinos made up 29.0% of Arizona's population.[9][10]
The state has the third highest number (and the sixth highest percentage) of Native Americans of any state in the Union. 286,680 were estimated to live in Arizona, representing more than 10% of the country's total Native American population of 2,752,158. Only California and Oklahoma[11] have more Native Americans. The perimeters of Phoenix, Tucson, Prescott, Flagstaff and Yuma border on Native American reservations.
The largest ancestry groups in Arizona are Mexican (25.8%), German (16.5%), English (10.3%), Irish (10.9%), and Native American (4.5%).[12] The southern and central parts of the state are predominantly Mexican American, especially in Santa Cruz County and Yuma County near the Mexican border. The north-central and northwestern counties are largely inhabited by White Americans. The northeastern part of Arizona has many American Indians. Asian Americans also made major contributions to the development of Arizona, such as the many Chinese who arrived in the state's mines and railroads, and the fact that over 20,000 Japanese Americans, mostly residing in the Grand Avenue section of Phoenix and farming areas of southern Arizona and the Colorado River valley, were interned during World War II. As of the 2010 US Census, Arizonans who claim Filipino ancestry exceed 53,000.[13] Filipino Americans are also the largest Asian American subgroup in the state.
Arizona is projected to become a minority-majority state by the year 2027,[14] if current population growth trends continue. In 2003, for the first time, there were slightly more births to Hispanics in the state than births to non-Hispanic whites. Since then, the gap has widened. In 2007, Hispanics accounted for 45% of all newborns whereas non-Hispanic whites accounted for 41% of all births. All of the other races accounted for 14% of births. However, by 2011 those trends reversed. By 2011, non-Hispanic whites accounted for 45.6% of all births while Hispanics births fell to 38.9%.[15]
Languages
| Language | Percentage of population (as of 2010)[16] |
|---|---|
| Spanish | 20.80% |
| Navajo | 1.48% |
| German and Chinese (including Mandarin) (tied) | 0.39% |
| Tagalog | 0.33% |
| Vietnamese | 0.30% |
| Other North American indigenous languages (especially indigenous languages of Arizona) | 0.27% |
| French | 0.26% |
| Arabic | 0.24% |
| Apache | 0.18% |
| Korean | 0.17% |
As of 2010, 72.90% (4,215,749) of Arizona residents age 5 and older spoke English at home as a primary language, while 20.80% (1,202,638) spoke Spanish, 1.48% (85,602) Navajo, 0.39% (22,592) German, 0.39% (22,426) Chinese (which includes Mandarin), 0.33% (19,015) Tagalog, 0.30% (17,603) Vietnamese, 0.27% (15,707) other North American indigenous languages (especially indigenous languages of Arizona), and French was spoken as a main language by 0.26% (15,062) of the population over the age of five. In total, 27.10% (1,567,548) of Arizona's population age 5 and older spoke a mother language other than English.[16]
Arizona is home to the largest number of speakers of Native American languages in the 48 contiguous states. Arizona's Apache County has the highest concentration of speakers of Native American Indian languages in the United States.[17]
See also the list of native peoples. See also the list of Indigenous languages of Arizona.
Religion
According to a 2008 survey by the Pew Forum on Religion and Public Life, the most common self-reported religious affiliation of Arizona residents are:[18]
- Catholicism - 25%
- Evangelical Christian - 23%
- Non-religious / Unaffiliated - 22%
- Protestantism - 15%
- Latter-Day Saints (Mormon) - 4%
- Judaism - 1.6%
- Others - 11%
L. Ron Hubbard, the founder of Scientology, lived in Phoenix during Scientology's formative years and thus Arizona has been labeled the "Birthplace of Scientology."[19]
According to the Association of Religion Data Archives,[20] the ten largest denominations by number of adherents in 2000 were:
| Religion | Population |
|---|---|
| Catholic Church | 974,884 |
| The Church of Jesus Christ of Latter-day Saints | 251,974 |
| Southern Baptist Convention | 138,516 |
| Assemblies of God | 82,802 |
| Judaism (Estimated) | 81,675 |
| Evangelical Lutheran Church in America | 69,393 |
| United Methodist Church | 53,232 |
| Independent, Non-Charismatic Churches Evangelical Protestant | 34,130 |
| Presbyterian Church (U.S.A.) | 33,554 |
| Christian Churches and Churches of Christ | 33,162 |
References
- ↑ Resident Population Data - 2010 Census
- ↑ "Table 1: Estimates of Population Change for the United States and States, and for Puerto Rico and State Rankings: July 1, 2005 to July 1, 2006". 2006 Population Estimates. U.S. Census Bureau, Population Division. December 22, 2006. Archived from the original on January 10, 2007. Retrieved December 22, 2006.
- ↑ Population Estimates - People and Households - U.S. Census Bureau
- ↑ John W. Wright, ed. (2007). The New York Times 2008 Almanac. p. 178.
- ↑ Chapman, Steve (April 23, 2010). "How immigration crackdowns backfire". Washington, DC: Washington Examiner. p. 31.
- ↑ Slevin, Peter (April 30, 2010). "New Arizona law puts police in 'tenuous' spot". Washington, DC: Washington Post. pp. A4.
- ↑ "Population and Population Centers by State - 2000". United States Census Bureau. Retrieved 2008-12-04.
- ↑ Arizona Population 2016. World Population Review
- ↑ Arizona - Fact Sheet - American FactFinder
- ↑ Arizona - ACS Demographic and Housing Estimates: 2005-2007
- ↑ Arizona QuickFacts from the US Census Bureau
- ↑ Arizona - Selected Social Characteristics in the United States: 2005-2007
- ↑ American FactFinder - Results
- ↑ http://www.tucsonweekly.com/TheRange/archives/2013/06/14/hispanics-leading-minority-growth-in-az
- ↑ "Births: Prelimanary Data for 2011" (PDF). National Vital Statistics Reports. U. S. Department of Health and Human Services. 61 (5). October 3, 2012.
- 1 2 "Arizona". Modern Language Association. Retrieved October 15, 2013.
- ↑ Arizona has most Indian language speakers. upi.com Accessed 2011-12-12.
- ↑ Pew Forum on Religion and Life Religious composition of Arizona residents, 2008. Margin of Error +/-4.5%
- ↑ Church of Scientology of Arizona
- ↑ The Association of Religion Data Archives | Maps & Reports