Demographics of New Zealand
| Demographics of New Zealand | |
|---|---|
 Population pyramid taken from the 2013 Census | |
| Population | 4,693,000 |
| Density | 17.5/km2 (45.3/sq mi) |
| Growth rate | 1.9%[1] |
| Birth rate | 13.27 per 1000 pop.[2] |
| Death rate | 6.87 per 1000 pop.[2] |
| Life expectancy | |
| • male | 79.5 years |
| • female | 83.2 years |
| Fertility rate | 1.99 births per woman[2] |
| Infant mortality rate | 4.11 per 1000 live births[2] |
| Net migration rate | 12.68 per 1000 pop.[1] |
| Age structure | |
| 0–14 years | 19.9%[1] |
| 15–64 years | 65.4%[1] |
| 65 and over | 14.7%[1] |
| Sex ratio | |
| Total | 0.97 males/female[1] |
| Under 15 | 1.05 males/female[1] |
| 15–64 years | 0.96 males/female[1] |
| 65 and over | 0.86 males/female[1] |
| Nationality | |
| Nationality | New Zealander |
| Major ethnic | European 74.0% |
| Minor ethnic |
|
| Language | |
| Official |
|
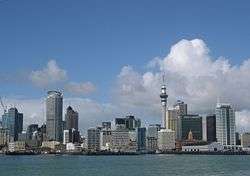
The demographics of New Zealand encompass the gender, ethnic, religious, geographic, and economic backgrounds of the 4.7 million people living in New Zealand. New Zealanders, informally known as "Kiwis", predominantly live in urban areas on the North Island. The five largest cities are Auckland (with one-third of the country's population), Christchurch (in the South Island, the largest island of the New Zealand archipelago), Wellington, Hamilton and Tauranga. Few New Zealanders live on New Zealand's smaller islands. Waiheke Island (near Auckland) is easily the most populated smaller island with 9,150 residents, while Great Barrier Island, the Chatham and Pitt Islands and Stewart Island each have populations below 1,000. New Zealand is part of a realm and most people born in the realm's external territories of Tokelau, the Ross Dependency, the Cook Islands and Niue are entitled to New Zealand passports. In 2006, more people who identified themselves with these islands lived in New Zealand than on the Islands themselves.
The majority of New Zealand's population is of European descent (69 percent identify as "New Zealand European"), with the indigenous Māori being the largest minority (14.6 percent), followed by Asians (9.2 percent) and non-Māori Pacific Islanders (6.9 percent). This is reflected in immigration, with most new migrants coming from Britain and Ireland, although the numbers from Asia are increasing. In 2001 an estimated 460,000 New Zealanders lived abroad, mostly in Australia, representing nearly one-quarter of NZ's highly skilled workforce. The largest Māori iwi is Ngapuhi with 122,211 people or 24 percent of the Māori population. Auckland is the most ethnically diverse region in New Zealand with 56.5 percent identifying as Europeans, 18.9 percent as Asian, 11.1 percent as Māori and 14.4 percent as other Pacific Islanders. The ethnicity of the population aged under 18 years is more diverse (72 percent European, 24 percent Māori, 12 percent Pacific and 10 percent Asian) than the population aged 65 years or older (91 percent European, 5 percent Māori, 4 percent Asian and 2 percent Pacific). Recent increases in interracial marriages have resulted in more people identifying with more than one ethnic group.
Estimates based on the 2013 census in New Zealand classify 14.90% of the population of New Zealand as Maori, 11.80% of the population as Asian (deriving from various nations in Asia), 7.40% as of Pacific Islander origin (including from the Cook Islands, Niue, and Tokelau, all of which are dependent states of New Zealand in the Pacific), and 1.20% as individuals of Middle-Eastern, Latin American, and African descent. Approximately three-quarters of the population of New Zealand during the census were of European ethnicity.[3]
English, Māori and New Zealand Sign Language are the official languages, with English predominant. New Zealand English is mostly non-rhotic and sounds similar to Australian English, with a common exception being the centralisation of the short i. The Maori language (te reo) has undergone a process of revitalisation and is spoken by 4.1 percent of the population. New Zealand has an adult literacy rate of 99 percent and over half of the population aged 15 to 29 hold a tertiary qualification. In the adult population 14.2 percent have a bachelor's degree or higher, 30.4 percent have some form of secondary qualification as their highest qualification and 22.4 percent have no formal qualification. As of the 2013 census, just under half the population identify as Christians, with Hinduism, Buddhism and Islam being the most significant minority religions.[4] New Zealand has no state religion and just over 40% of the population do not have a religion.
Farming is a major occupation in New Zealand, although more people are employed as sales assistants. Most New Zealanders earn wage or salary income, with a median personal income in 2006 of $24,400. Unemployment stood at 5.1 percent in June 2016.
Terminology
While the demonym for a New Zealand citizen is New Zealander, the informal "Kiwi" is commonly used both internationally[5] and by locals.[6] The name derives from the kiwi, a native flightless bird, which is the national symbol of New Zealand. The Māori loanword Pākehā usually refers to New Zealanders of European descent, although some reject this appellation,[7][8] and some Māori use it to refer to all non-Polynesian New Zealanders.[9] Most people born in New Zealand or one of the realm's external territories (Tokelau, the Ross Dependency, the Cook Islands and Niue) before 2006 are New Zealand citizens. Further conditions apply for those born from 2006 onwards.[10]
Population
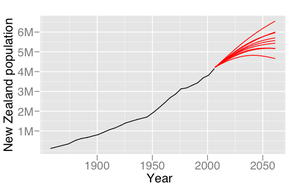
In 2014 New Zealand has an estimated population of just over 4.5 million,[11] up from the 4,027,947 recorded in the 2006 census.[12] The median child birthing age was 30 and the fertility rate is 2.1 births per woman in 2010. In Māori populations the median age is 26 and fertility rate 2.8.[13] In 2010 the Age-standardized mortality rate was 3.8 deaths per 1000 (down from 4.8 in 2000) and the infant mortality rate for the total population was 5.1 deaths per 1000 live births.[13] The life expectancy of a New Zealand child born in 2008 was 82.4 years for females, and 78.4 years for males.[14] Life expectancy at birth is forecast to increase from 80 years to 85 years in 2050 and infant mortality is expected to decline.[15] In 2050 the population is forecast to reach 5.3 million, the median age to rise from 36 years to 43 years and the percentage of people 60 years of age and older rising from 18 percent to 29 percent.[15] During early migration in 1858, New Zealand had 131 males for every 100 females, but following changes in migration patterns and the modern longevity advantage of women, females came to outnumber males in 1971.[16] As of 2012 there are 0.99 males per female, with males dominating under 15 years and females dominating in the 65 years and older range.[17]
| Vital statistics since 1921[18] | ||||||||
|---|---|---|---|---|---|---|---|---|
| Average population (x 1,000) | Live births | Deaths | Natural change | Crude birth rate (per 1,000) | Crude death rate (per 1,000) | Natural change (per 1,000) | Fertility rates | |
| 1921 | 29,623 | 11,474 | 18,149 | 3.08 | ||||
| 1922 | 30,448 | 11,874 | 18,574 | 3.08 | ||||
| 1923 | 29,148 | 12,239 | 16,909 | 23.7 | 9.9 | 13.8 | 2.96 | |
| 1924 | 29,260 | 11,540 | 17,720 | 23.2 | 9.4 | 13.8 | 2.93 | |
| 1925 | 29,869 | 11,844 | 18,025 | 22.9 | 9.2 | 13.7 | 2.90 | |
| 1926 | 29,904 | 12,517 | 17,387 | 22.0 | 9.4 | 12.6 | 2.88 | |
| 1927 | 1,429 | 29,278 | 12,600 | 16,678 | 20.3 | 8.8 | 11.5 | 2.79 |
| 1928 | 1,450 | 28,398 | 12,860 | 15,538 | 19.8 | 8.8 | 11.0 | 2.70 |
| 1929 | 1,467 | 28,859 | 13,220 | 15,639 | 19.5 | 9.0 | 10.5 | 2.64 |
| 1930 | 1,486 | 28,822 | 13,145 | 15,677 | 19.3 | 8.8 | 10.5 | 2.60 |
| 1931 | 1,506 | 28,867 | 13,062 | 15,805 | 19.1 | 8.6 | 10.5 | 2.56 |
| 1932 | 1,522 | 27,535 | 12,875 | 14,660 | 18.0 | 8.4 | 9.6 | 2.38 |
| 1933 | 1,534 | 27,204 | 12,862 | 14,342 | 17.7 | 8.3 | 9.4 | 2.31 |
| 1934 | 1,547 | 27,220 | 13,810 | 13,410 | 17.5 | 8.9 | 8.6 | 2.29 |
| 1935 | 1,558 | 27,150 | 13,664 | 13,486 | 17.4 | 8.7 | 8.7 | 2.25 |
| 1936 | 1,569 | 28,395 | 14,658 | 13,737 | 18.0 | 9.3 | 8.7 | 2.30 |
| 1937 | 1,584 | 29,896 | 15,215 | 17,681 | 18.8 | 9.6 | 9.2 | 2.39 |
| 1938 | 1,601 | 30,845 | 16,874 | 13,971 | 19.2 | 10.5 | 8.7 | 2.44 |
| 1939 | 1,618 | 32,872 | 15,933 | 16,939 | 20.2 | 9.8 | 10.4 | 2.56 |
| 1940 | 1,641 | 36,945 | 15,875 | 21,070 | 22.6 | 9.7 | 12.9 | 2.84 |
| 1941 | 1,633 | 39,170 | 17,047 | 22,123 | 24.0 | 10.4 | 13.6 | 2.93 |
| 1942 | 1,631 | 37,818 | 18,117 | 19,701 | 23.1 | 11.1 | 12.0 | 2.87 |
| 1943 | 1,636 | 34,684 | 17,122 | 17,562 | 21.2 | 10.4 | 10.8 | 2.61 |
| 1944 | 1,642 | 38,037 | 17,049 | 20,088 | 22.9 | 10.3 | 12.6 | 2.85 |
| 1945 | 1,676 | 51,534 | 17,686 | 33,848 | 24.4 | 10.4 | 14.0 | 3.10 |
| 1946 | 1,724 | 47,524 | 17,720 | 29,804 | 27.1 | 10.1 | 17.0 | 3.45 |
| 1947 | 1,781 | 49,698 | 17,442 | 32,256 | 27.6 | 9.7 | 17.9 | 3.63 |
| 1948 | 1,817 | 49,062 | 17,285 | 31,777 | 26.7 | 9.4 | 17.3 | 3.57 |
| 1949 | 1,853 | 48,841 | 17,578 | 31,263 | 26.1 | 9.4 | 16.7 | 3.53 |
| 1950 | 1,892 | 49,331 | 18,084 | 31,247 | 25.8 | 9.5 | 16.3 | 3.55 |
| 1951 | 1,927 | 49,806 | 18,836 | 30,970 | 25.6 | 9.7 | 15.9 | 3.60 |
| 1952 | 1,970 | 51,846 | 18,896 | 32,950 | 26.0 | 9.5 | 16.5 | 3.67 |
| 1953 | 2,024 | 51,888 | 18,354 | 33,534 | 25.3 | 9.0 | 16.3 | 3.65 |
| 1954 | 2,074 | 54,055 | 18,876 | 35,179 | 25.8 | 9.0 | 16.8 | 3.78 |
| 1955 | 2,118 | 55,596 | 19,225 | 36,371 | 26.0 | 9.0 | 17.0 | 3.88 |
| 1956 | 2,164 | 56,631 | 19,696 | 36,935 | 25.8 | 9.0 | 16.8 | 3.98 |
| 1957 | 2,209 | 58,425 | 20,862 | 37,563 | 26.1 | 9.3 | 16.8 | 4.03 |
| 1958 | 2,262 | 60,556 | 20,301 | 40,255 | 26.5 | 8.9 | 17.6 | 4.11 |
| 1959 | 2,316 | 61,798 | 21,128 | 40,670 | 26.4 | 9.0 | 17.4 | 4.18 |
| 1960 | 2,359 | 62,779 | 20,892 | 41,787 | 26.4 | 8.8 | 17.6 | 4.24 |
| 1961 | 2,403 | 65,390 | 21,782 | 43,608 | 26.9 | 9.0 | 17.9 | 4.31 |
| 1962 | 2,461 | 65,014 | 22,081 | 42,933 | 26.1 | 8.9 | 17.2 | 4.19 |
| 1963 | 2,515 | 64,527 | 22,416 | 42,111 | 25.4 | 8.8 | 16.6 | 4.05 |
| 1964 | 2,566 | 62,302 | 22,861 | 39,441 | 24.0 | 8.8 | 15.2 | 3.80 |
| 1965 | 2,617 | 60,047 | 22,976 | 37,071 | 22.7 | 8.7 | 14.0 | 3.54 |
| 1966 | 2,663 | 60,003 | 23,778 | 36,225 | 22.3 | 8.8 | 13.5 | 3.41 |
| 1967 | 2,711 | 61,022 | 23,007 | 38,015 | 22.4 | 8.4 | 14.0 | 3.35 |
| 1968 | 2,745 | 62,112 | 24,464 | 37,648 | 22.5 | 8.9 | 13.6 | 3.37 |
| 1969 | 2,773 | 62,360 | 24,161 | 38,199 | 22.4 | 8.7 | 13.7 | 3.28 |
| 1970 | 2,804 | 62,050 | 24,840 | 37,210 | 21.9 | 8.8 | 13.1 | 3.17 |
| 1971 | 2,852 | 64,460 | 24,309 | 40,151 | 22.4 | 8.5 | 13.9 | 3.18 |
| 1972 | 2,898 | 63,215 | 24,801 | 38,414 | 21.6 | 8.5 | 13.1 | 3.00 |
| 1973 | 2,959 | 60,727 | 25,312 | 35,415 | 20.3 | 8.5 | 11.8 | 2.76 |
| 1974 | 3,024 | 59,936 | 25,261 | 34,675 | 19.4 | 8.3 | 11.1 | 2.58 |
| 1975 | 3,091 | 56,639 | 25,114 | 31,525 | 18.2 | 8.1 | 10.1 | 2.37 |
| 1976 | 3,143 | 55,105 | 25,547 | 29,458 | 17.5 | 8.1 | 9.4 | 2.27 |
| 1977 | 3,163 | 54,179 | 25,961 | 29,218 | 17.1 | 8.2 | 8.9 | 2.21 |
| 1978 | 3,166 | 51,029 | 24,669 | 26,360 | 16.1 | 7.8 | 8.3 | 2.07 |
| 1979 | 3,165 | 52,279 | 25,340 | 26,939 | 16.5 | 8.0 | 8.5 | 2.12 |
| 1980 | 3,163 | 50,542 | 26,676 | 23,866 | 15.9 | 8.4 | 7.5 | 2.03 |
| 1981 | 3,176 | 50,794 | 25,150 | 25,644 | 15.9 | 7.9 | 8.0 | 2.01 |
| 1982 | 3,194 | 49,938 | 25,532 | 24,406 | 15.6 | 8.0 | 8.6 | 1.95 |
| 1983 | 3,226 | 50,474 | 25,991 | 24,483 | 15.6 | 8.0 | 8.6 | 1.92 |
| 1984 | 3,264 | 51,636 | 25,378 | 26,258 | 15.7 | 7.7 | 8.0 | 1.93 |
| 1985 | 3,293 | 51,798 | 27,480 | 24,318 | 15.7 | 8.3 | 7.4 | 1.93 |
| 1986 | 3,303 | 52,824 | 27,045 | 25,779 | 16.2 | 8.2 | 8.0 | 1.96 |
| 1987 | 3,313 | 55,254 | 27,419 | 27,835 | 16.6 | 8.2 | 8.4 | 2.03 |
| 1988 | 3,342 | 57,546 | 27,408 | 30,138 | 17.2 | 8.2 | 9.0 | 2.10 |
| 1989 | 3,345 | 58,091 | 27,042 | 31,049 | 17.3 | 8.1 | 9.2 | 2.12 |
| 1990 | 3,369 | 60,153 | 26,531 | 33,622 | 17.7 | 7.8 | 9.9 | 2.18 |
| 1991 | 3,410 | 59,911 | 26,389 | 33,522 | 17.3 | 7.6 | 9.7 | 2.09 |
| 1992 | 3,516 | 59,166 | 27,115 | 32,051 | 16.7 | 7.7 | 9.0 | 2.06 |
| 1993 | 3,552 | 58,782 | 27,100 | 31,682 | 16.4 | 7.6 | 8.8 | 2.04 |
| 1994 | 3,597 | 57,321 | 26,953 | 30,258 | 15.8 | 7.4 | 8.4 | 1.98 |
| 1995 | 3,648 | 57,671 | 27,813 | 29,858 | 15.7 | 7.6 | 8.1 | 1.98 |
| 1996 | 3,706 | 57,280 | 28,255 | 29,025 | 15.3 | 7.6 | 7.7 | 1.96 |
| 1997 | 3,762 | 57,604 | 27,471 | 30,133 | 15.2 | 7.3 | 7.9 | 1.95 |
| 1998 | 3,802 | 55,349 | 26,206 | 29,143 | 14.5 | 6.9 | 7.6 | 1.89 |
| 1999 | 3,829 | 57,053 | 28,122 | 28,931 | 14.9 | 7.3 | 7.6 | 1.97 |
| 2000 | 3,851 | 56,605 | 26,660 | 29,945 | 14.7 | 6.9 | 7.8 | 1.98 |
| 2001 | 3,873 | 55,799 | 27,825 | 27,974 | 14.3 | 7.1 | 7.2 | 1.97 |
| 2002 | 3,916 | 54,021 | 28,065 | 25,956 | 13.7 | 7.1 | 6.6 | 1.88 |
| 2003 | 3,989 | 56,134 | 28,010 | 28,124 | 13.9 | 7.0 | 6.9 | 1.93 |
| 2004 | 4,061 | 58,073 | 28,419 | 29,654 | 14.2 | 7.0 | 7.2 | 1.99 |
| 2005 | 4,114 | 57,745 | 27,034 | 30,711 | 14.0 | 6.5 | 7.5 | 1.97 |
| 2006 | 4,161 | 59,193 | 28,245 | 30,948 | 14.1 | 6.7 | 7.4 | 2.01 |
| 2007 | 4,211 | 64,044 | 28,522 | 35,522 | 15.1 | 6.7 | 8.4 | 2.17 |
| 2008 | 4,252 | 64,343 | 29,188 | 35,155 | 15.1 | 6.8 | 8.3 | 2.18 |
| 2009 | 4,291 | 62,543 | 28,964 | 33,579 | 14.5 | 6.7 | 7.8 | 2.12 |
| 2010 | 4,370 | 63,897 | 28,440 | 35,457 | 14.6 | 6.5 | 8.1 | 2.15 |
| 2011 | 4,408 | 61,400 | 30,080 | 31,320 | 13.9 | 6.8 | 7.1 | 2.06 |
| 2012 | 4,438 | 61,178 | 30,099 | 31,079 | 13.8 | 6.8 | 7.0 | 2.05 |
| 2013 | 4,479 | 58,727 | 29,568 | 29,159 | 13.1 | 6.6 | 6.5 | 1.95 |
| 2014 | 4,554 | 57,242 | 31,063 | 26,179 | 12.7 | 6.9 | 5.8 | 1.92 |
| 2015 | 4,649 | 61,038 | 31,608 | 29,430 | 13.3 | 6.9 | 6.4 | 1.99 |
Geography
Population density
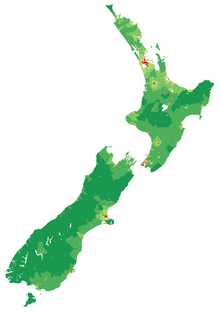
Over three-quarters of New Zealands population live in the North Island (76.6 percent) with one-third of the total population living in the Auckland Region. This region is also the fastest growing, accounting for 46 percent of New Zealand's total population growth. Most Māori live in the North Island (87 percent), although less than a quarter (24 percent) live in Auckland. New Zealand is a predominantly urban country, with 86.4 percent of the population living in an urban area. About 73.0 percent of the population live in the 17 main urban areas (population of 30,000 or more) and 53.7 percent live in the four largest cities of Auckland, Christchurch, Wellington, and Hamilton.[19]
Approximately 14 percent of the population live in four different categories of rural areas as defined by Statistics New Zealand. About 18 percent of the rural population live in areas that have a high urban influence (roughly 12.9 people per square kilometre), many working in the main urban area. Rural areas with moderate urban influence and a population density of about 6.5 people per square kilometre account for 26 percent of the rural population. Areas with low urban influence where the majority of the residents work in the rural area house approximately 42 percent of the rural population. Remote rural areas with a density of less than 1 person per square kilometre account for about 14 percent of the rural population.[20]
The vast majority of the population live on the main North and South Islands, with New Zealand's major inhabited smaller islands being Waiheke Island (9,150), Chatham and Pitt Islands (610), and Stewart Island (402).[21] In 2006, 15,342 people were residents of the Cook Islands, with two thirds living on Rarotonga, and the other third spread over the other 14 islands.[22] The resident population of Tokelau and Niue was 1,466[23] and 1,625[24] respectively in 2006. At the time 58,008 Cook Islanders, 22,476 Niueans and 6,819 Tokelauans lived in New Zealand.[25]
Regions and urban areas
Before local government reforms in the late 1980s, a borough council with more than 20,000 people could be proclaimed a city.[26] The boundaries of councils tended to follow the edge of the built-up area, so there was little difference between the urban area and the local government area. In 1989 the councils were consolidated into 67 territorial authorities and 11 regional councils, which cover a much wider area and population.[27] Today the term "city" may be used in an unofficial capacity to describe a large urban area, irrespective of local government (council) boundaries. The twenty-largest urban areas (or cities) are listed below:
| | |||||||||
|---|---|---|---|---|---|---|---|---|---|
| Rank | Name | Region | Pop. | Rank | Name | Region | Pop. | ||
 Auckland 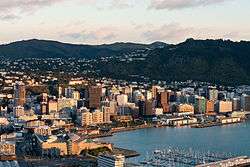 Wellington |
1 | Auckland | Auckland | 1,495,000 | 11 | New Plymouth | Taranaki | 56,800 |  Christchurch 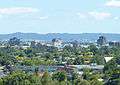 Hamilton |
| 2 | Wellington | Wellington | 405,000 | 12 | Whangarei | Northland | 56,400 | ||
| 3 | Christchurch | Canterbury | 389,700 | 13 | Invercargill | Southland | 50,700 | ||
| 4 | Hamilton | Waikato | 230,000 | 14 | Kapiti | Wellington | 41,800 | ||
| 5 | Tauranga | Bay of Plenty | 134,400 | 15 | Whanganui | Manawatu-Wanganui | 39,600 | ||
| 6 | Napier-Hastings | Hawke's Bay | 131,000 | 16 | Gisborne | Gisborne | 36,100 | ||
| 7 | Dunedin | Otago | 118,500 | 17 | Blenheim | Marlborough | 30,700 | ||
| 8 | Palmerston North | Manawatu-Wanganui | 84,300 | 18 | Pukekohe | Auckland | 29,800 | ||
| 9 | Nelson | Nelson | 65,700 | 19 | Timaru | Canterbury | 28,800 | ||
| 10 | Rotorua | Bay of Plenty | 57,800 | 20 | Taupo | Waikato | 24,100 | ||
Migration
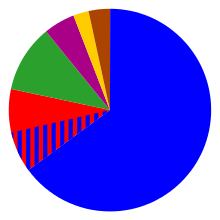
| Country | Number | % |
|---|---|---|
| | 2,980,827 | 74.85 |
| | 256,164 | 6.43 |
| | 96,441 | 2.42 |
| | 67,176 | 1.69 |
| | 62,712 | 1.57 |
| | 54,279 | 1.36 |
| | 52,755 | 1.32 |
| | 50,658 | 1.27 |
| | 37,299 | 0.94 |
| | 26,604 | 0.67 |
| | 22,416 | 0.56 |
| | 21,462 | 0.54 |
| | 19,815 | 0.50 |
| | 16,353 | 0.41 |
| | 12,954 | 0.33 |
| | 12,942 | 0.32 |
| | 10,269 | 0.26 |
| Other countries | 188,814 | 4.74 |
| ||
East Polynesians were the first people to reach New Zealand about 1280, followed by the early European explorers, notably James Cook in 1769 who explored New Zealand three times and mapped the coastline. Following the Treaty of Waitangi in 1840 when the country became a British colony, immigrants were predominantly from Britain, Ireland and Australia. Due to restrictive policies similar to the white Australian policies limitations were placed on non-European immigrants.[29] During the gold rush period (1858-1880s) large number of young men came from California and Victoria to New Zealand goldfields. Apart from British, there were Irish, North Germans, Scandinavians, Italian and many Chinese. The Chinese were sent special invitations by the Otago Chamber of Commerce in 1866. By 1873 they made up 40 percent of the diggers in Otago and 25 percent of the diggers in Westland.[30] From 1900 there was also significant Dutch, Dalmatian,[31] Italian, and German immigration together with indirect European immigration through Australia, North America, South America and South Africa.[32] Following the Great Depression policies were relaxed and migrant diversity increased. In 2008–09, a target of 45,000 migrants was set by the New Zealand Immigration Service (plus a 5,000 tolerance).[33]
Just over 25 percent of New Zealand's population at the 2013 Census was born overseas, up from 23 percent in 2006 and 20 percent in 2001. Over half (51.6 percent) of New Zealand's overseas-born population lives in the Auckland Region, including 72 percent of the country's Pacific Island-born population, 64 percent of its Asian-born population, and 56 percent of its Middle Eastern and African- born population.[34] In the late 2000s, Asia overtook the British Isles as the largest source of overseas migrants; today around 32 percent of overseas-born New Zealand residents were born in Asia (mainly China, India, the Philippines and South Korea) compared to 26 percent born in the UK and Ireland.[35] The number of fee-paying international students increased sharply in the late 1990s, with more than 20,000 studying in public tertiary institutions in 2002.[36]
To be eligible for entry under the skilled migrant plan applicants are assessed by an approved doctor for good health, provide a police certificate to prove good character and speak sufficient English. Migrants working in some occupations (mainly health) must be registered with the appropriate profession body before they can work within that area.[37] Skilled migrants are assessed by Immigration New Zealand and applicants that they believe will contribute are issued with a residential visa, while those with potential are issued with a work to resident visa.[38] Under the work to residency process applicants are given a temporary work permit for two years and are then eligible to apply for residency.[39] Applicants with a job offer from an accredited New Zealand employer, cultural or sporting talent, looking for work where there has been a long-term skill shortage or to establish a business can apply for work to residency.[39][40]
While most New Zealanders live in New Zealand, there is also a significant diaspora abroad, estimated as of 2001 at over 460,000 or 14 percent of the international total of New Zealand-born. Of these, 360,000, over three-quarters of the New Zealand-born population residing outside of New Zealand, live in Australia. Other communities of New Zealanders abroad are concentrated in other English-speaking countries, specifically the United Kingdom, the United States and Canada, with smaller numbers located elsewhere.[41] Nearly one quarter of New Zealand's highly skilled workers live overseas, mostly in Australia and Britain, more than any other developed nation.[42] However many educated professionals from Europe and lesser developed countries have recently migrated to New Zealand.[43][44] A common pathway for New Zealanders to move to the UK is through a job offer via the Tier 2 (General) visa, which grants a 3-year initial stay in the country and can later be extended with three more years. After 5 years the person can apply for permanent residency. Another popular option is the UK Working Holiday visa, also known as "Youth Mobility Scheme" (YMS), which grants New Zealanders 2-year rights to live and work in the UK. [45]
Ethnicity
New Zealand is a multiethnic society, and home to people of many different national origins. Originally composed solely of the Māori who arrived in the thirteenth century, the ethnic makeup of the population later became dominated by New Zealanders of European descent.[47] In the nineteenth century, European settlers brought diseases for which the Māori population had no immunity. By the 1890s, the Māori population was approximately 40 percent of its size pre-contact.[47] Most New Zealanders are of British and Irish ancestry, with smaller percentages of other European ancestries such as French, Dutch, Scandinavian and German. In the 2006 census, 67.6 percent identified ethnically as European and 14.6 percent as Māori.[48] Other major ethnic groups include Asian (9.2 percent) and Pacific peoples (6.9 percent), while 11.1 percent identified themselves simply as a "New Zealander" (or similar) and 1 percent identified with other ethnicities.[49][n 1] This contrasts with 1961, when the census reported that the population of New Zealand was 92 percent European and 7 percent Māori, with Asian and Pacific minorities sharing the remaining 1 percent.[51]
During the 2013 census in New Zealand, it was estimated that 14.90% of the population of New Zealand were Maori, 11.80% of the population were Asians (deriving from various nations in Asia), 7.40% were of Pacific Islander origin (including from the Cook Islands, Niue, and Tokelau, all of which are dependent states of New Zealand in the Pacific), and 1.20% were individuals of Middle-Eastern, Latin American, and African descent.
The largest Māori iwi is Ngapuhi with 122,211 people (or 18.97 per cent) of the Māori population. The next largest iwi are Ngāti Porou, Ngāti Kahungunu, Ngāi Tahu/ Kāi Tahu, Te Arawa, Ngāti Tūwharetoa, Ngāti Maniapoto, Waikato and Tūhoe. A total of 102,366 people (or 15.90 per cent) of Māori descent did not know their iwi.[52] A group of Māori migrated to the Chatham Islands and developed their distinct Moriori culture.[53][54] The Moriori population was decimated, first, by disease brought by European sealers and whalers and, second, by Taranaki Māori, with only 101 surviving in 1862 and the last known full-blooded Moriori dying in 1933.[55] People identifying as having Moriori descents have increased in number in recent years, from 105 in 1991 to 945 in 2006.[56]
Auckland is the most ethnically diverse region in New Zealand with 56.5 percent identifying as Europeans, 18.9 percent as Asian, 11.1 percent as Māori and 14.4 percent as other Pacific Islanders.[57] Recent increases in interracial marriages has resulted in the New Zealand population of Māori, Asian and Pacific Islander descent growing at a higher rate than those of European descent.[58] In 2006 10.4 percent of people, identified with more than one ethnic group in 2006, compared with 9.0 percent in 2001.[57] The ethnic diversity of New Zealand is projected to increase. Europeans (including "New Zealanders") will remain the largest group, although it is predicted to fall to 70 percent in 2026. The Asian, Pacific and Māori groups are the fastest growing and will increase to 3.4 percent, 10 percent and 16 percent respectively.[59] The ethnicity of the population aged under 18 years at 30 June 2006 was 72 percent European, 24 percent Māori, 12 percent Pacific and 10 percent Asian. The population aged 65 years or older consisted of 91 percent European, 5 percent Māori, 4 percent Asian and 2 percent Pacific.[59]
The maps below (taken from 2013 Census data)show the percentages of people in each census area unit identifying themselves as European, Māori, Asian, or Pacific Islander (as defined by Statistics New Zealand). As people could identify themselves with multiple groups, percentages are not cumulative.
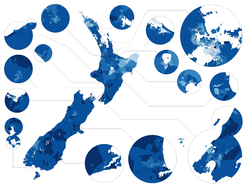 European (Pākehā)Less than 5%More than 5%More than 10%More than 20%More than 30%More than 40%More than 50%More than 60%More than 70%More than 80%More than 90%
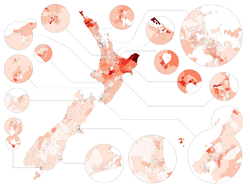 MāoriLess than 5%More than 5%More than 10%More than 20%More than 30%More than 40%More than 50%More than 60%More than 70%More than 80%
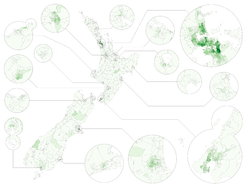 AsianLess than 5%More than 5%More than 10%More than 20%More than 30%More than 40%More than 50%More than 60%More than 70%
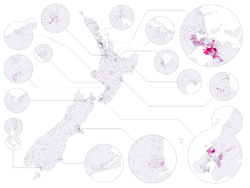 Pacific IslanderLess than 5%More than 5%More than 10%More than 20%More than 30%More than 40%More than 50%More than 60%More than 70%
Language
English is the predominant language in New Zealand, spoken by 98 percent of the population.[60] New Zealand English is mostly non-rhotic with an exception being the Southern Burr found principally in Southland and parts of Otago.[61] It is similar to Australian English and many speakers from the Northern Hemisphere are unable to tell the accents apart.[62] In New Zealand English the short i (as in kit) has become centralised, leading to the phrase fish and chips sounding like "fush and chups" to the Australian ear.[63] The words rarely and really, reel and real, doll and dole, pull and pool, witch and which, and full and fill can sometimes be pronounced as homophones.[64][65][61] Some New Zealanders pronounce the past participles grown, thrown and mown using two syllables, whereas groan, throne and moan are pronounced as one syllable.[66] New Zealanders often reply to a question or emphasise a point by adding a rising intonation at the end of the sentence.[67]
Initially, the Māori language was permitted in native schools to facilitate English instruction, but as time went on official attitudes hardened against any use of the language. Māori were discouraged from speaking their own language in schools and work places and it existed as a community language only in a few remote areas.[68] It has recently undergone a process of revitalisation,[69][70] being declared an official language in 1987,[71] and is spoken by 4.1 percent of the population.[60] There are now Māori language immersion schools and two Māori Television channels, the only nationwide television channels to have the majority of their prime-time content delivered in Māori.[72] Many places have officially been given dual Māori and English names in recent years.
Samoan is the most widely spoken non-official language (2.3 percent),[n 2] followed by French, Hindi, Yue and Northern Chinese.[60][73][n 3] New Zealand Sign Language is used by approximately 28,000 people and was made New Zealand's third official language in 2006.[74][75]
Education
Education follows the three-tier model, which includes primary schools, followed by secondary schools (high schools) and tertiary education at universities or polytechnics. The Programme for International Student Assessment ranked New Zealand's education as the seventh highest in 2009.[76] The Education Index, published with the UN's 2008 Human Development Index and based on data from 2006, listed New Zealand at 0.993, tied for first with Denmark, Finland and Australia.[77]
Primary and secondary schooling is compulsory for children aged 6 to 16[78] with most children starting at 5. Early leaving exemptions may be granted to 15-year-old students that have been experiencing some ongoing difficulties at school or are unlikely to benefit from continued attendance.[79] Parents and caregivers can home school their children if they obtain approval from the Ministry of Education and prove that their child will be taught "as regularly and as well as in a registered school".[80] There are 13 school years and attending state (public) schools is nominally free from a person's fifth birthday until the end of the calendar year following their 19th birthday.[80][81]
The academic year in New Zealand varies between institutions, but generally runs from late January until mid-December for primary and secondary schools and polytechnics, and from late February until mid-November for universities. New Zealand has an adult literacy rate of 99 percent,[82] and over half of the population aged 15 to 29 hold a tertiary qualification.[78][n 4] In the adult population 14.2 percent have a bachelor's degree or higher, 30.4 percent have some form of secondary qualification as their highest qualification and 22.4 percent have no formal qualification.[83]
Religion
Christianity is the predominant religion in New Zealand at just under half of the population at the 2013 New Zealand Census, although regular church attendance is probably closer to 15 percent.[84] In the 2006 Census, 55.6 percent of the population identified themselves as Christians, while another 34.7 percent indicated that they had no religion (up from 29.6 percent in 2001) and around 4 percent affiliated with other religions.[85][n 5] Immigrants make up 80 percent of most of the non-Christian religions,[86] with the traditional Māori religion, Judaism (24 percent immigrant) and Bahá'í (20 percent immigrant) being the exceptions.[87]
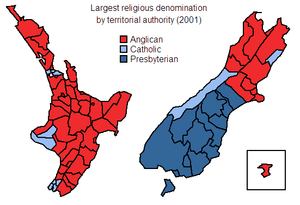
The traditional religion of the indigenous Māori population was animistic, but with the arrival of missionaries from the early nineteenth century most of the Māori population converting to Christianity.[88] In 2006, 2,412 Māori still identify themselves as adhering to traditional Māori beliefs.[89] The main Christian denominations are Roman Catholicism, Anglicanism, Presbyterianism and Methodism. There are also significant numbers of Christians who identify themselves with Pentecostal, Baptist, and Latter-day Saint churches and the New Zealand-based Ratana church has adherents among Māori. According to census figures, other significant minority religions include Hinduism, Buddhism, and Islam.[73][90] New Zealand has no state religion and freedom of religion has been protected since the signing of the Treaty of Waitangi.[91]
Income
New Zealand's early economy was based on sealing, whaling, flax, gold, kauri gum, and native timber.[92] During the 1880s agricultural products became the highest export earner and farming was a major occupation within New Zealand.[93] Farming is still a major employer, with 75 000 people indicating farming as their occupation during the 2006 census,[94] although dairy farming has recently taken over from sheep as the largest sector.[93] The largest occupation recorded during the census was sales assistant with 93,840 people.[94] Most people are on wages or salaries (59.9 percent), with the other sources of income being interest and investments (24.1 percent) and self-employment (16.6 percent).[95]
In 1982 New Zealand had the lowest per-capita income of all the developed nations surveyed by the World Bank.[96] In 2010 the estimated gross domestic product (GDP) at purchasing power parity (PPP) per capita was roughly US$28,250, between the thirty-first and fifty-first highest for all countries.[n 6] The median personal income in 2006 was $24,400. This was up from $15,600 in 1996, with the largest increases in the $50,000 to $70,000 bracket.[100] The median income for men was $31,500, $12,400 more than women.[101] The highest median personal income were for people identifying with the European or "other" ethnic group, while the lowest was from the Asian ethnic group. The median income for people identifying as Māori was $20,900.[102]
Unemployment peaked above 10 percent in 1991 and 1992,[103] before falling to a record low of 3.4 percent in 2007 (ranking fifth from twenty-seven comparable OECD nations).[104] Unemployment rose back to 7 percent in late 2009[105] and was 6.8 percent during the June 2010 quarter.[106] The 2006 census reported that while the proportion of people with no source of income was the same as 2001, the number of people receiving the unemployment benefit dropped 48 percent.[95] Most New Zealanders do some form of voluntary work, more women volunteer (92 percent) than males (86 percent).[107] Home ownership has declined since 1991, from 73.8 percent to 66.9 percent in 2006.[108]
See also
- American New Zealander
- British New Zealander
- Chinese New Zealander
- Dutch New Zealanders
- Greeks in New Zealand
- Indian New Zealander
- Jewish New Zealander
- Korean New Zealander
- Scottish New Zealander
Notes
- ↑ When completing the census people could select more than one ethnic group (for instance, 53 percent of Māori identified solely as Māori, while the remainder also identified with one or more other ethnicities).[50]
- ↑ Of the 85,428 people that replied they spoke Samoan in the 2006 Census, 57,828 lived in the Auckland region.[73]
- ↑ Languages listed here are those spoken by over 40,000 New Zealanders.
- ↑ Tertiary education in New Zealand is used to describe all aspects of post-school education and training. Its ranges from informal non-assessed community courses in schools through to undergraduate degrees and advanced, research-based postgraduate degrees.
- ↑ Another 6 percent objected to stating their religion. Statistics NZ do not report a total percentage for "Other" religions. Depending on how many people claimed both Christian and other religions, this could range from 3 to 5 percent. These percentages are based on the usually resident population, excluding another 7 percent of people who did not provide usable information.
- ↑ PPP GDP estimates from different organisations vary. The International Monetary Fund's estimate is US$27,420, ranked 32.[97] The CIA World Factbook estimate is $28,000, ranked 51.[98] The World Bank's estimate is US$29,352, ranked 31.[99]
References
- 1 2 3 4 5 6 7 8 9 "National Population Estimates: At 30 June 2015". Statistics New Zealand. 14 August 2015. Retrieved 6 March 2016.
- 1 2 3 4 "Births and Deaths: Year ended December 2015". Statistics New Zealand. 17 December 2016. Retrieved 6 March 2016.
- ↑ http://www.stats.govt.nz/Census/2013-census/profile-and-summary-reports/quickstats-about-national-highlights/cultural-diversity.aspx
- ↑ "2013 Census QuickStats about culture and identity". Statistics New Zealand. Retrieved 1 July 2015.
- ↑ Dalby, Simon (September 1993). "The 'Kiwi disease': geopolitical discourse in Aotearoa/New Zealand and the South Pacific". Political Geography. Elsevier. 12 (5): 437–456. doi:10.1016/0962-6298(93)90012-V.
- ↑ Callister, Paul (2004). "Seeking an Ethnic Identity: Is "New Zealander" a Valid Ethnic Category?" (PDF). New Zealand Population Review. 30 (1&2): 5–22.
- ↑ Misa, Tapu (8 March 2006). "Ethnic Census status tells the whole truth". New Zealand Herald.
- ↑ "Draft Report of a Review of the Official Ethnicity Statistical Standard: Proposals to Address the 'New Zealander' Response Issue" (pdf). Statistics New Zealand. April 2009. Retrieved 18 January 2011.
- ↑ Ranford, Jodie. "'Pakeha', Its Origin and Meaning". Māori News. Retrieved 20 February 2008.
- ↑ "Am I a New Zealand Citizen?". New Zealand Department of Internal Affairs. Retrieved 3 March 2011.
- ↑ "Estimated resident population of New Zealand". Statistics New Zealand. Retrieved 30 January 2011. The population clock updates every 10 minutes.
- ↑ "QuickStats About New Zealand's Population and Dwellings". Statistics New Zealand. Retrieved 8 May 2011.
- 1 2 "Births and Deaths: Year ended December 2010". Statistics New Zealand. Retrieved 13 April 2011.
- ↑ "Commentary". Births and Deaths: December 2009 quarter. Statistics New Zealand. Retrieved 27 April 2010.
- 1 2 Department of Economic and Social Affairs Population Division (2009). "World Population Prospects" (PDF). 2008 revision. United Nations. Retrieved 29 August 2009.
- ↑ "Sex ratios". Population Statistics Unit, Statistics New Zealand Statistics House.
- ↑ "Sex Ratio". The World Factbook. CIA. Retrieved 13 April 2011.
- ↑ http://www.ined.fr/en/pop_figures/developed_countries/developed_countries_database/
- 1 2 "Subnational Population Estimates: At 30 June 2016 (provisional)". Statistics New Zealand. 21 October 2016. Retrieved 21 October 2016. For urban areas, "Subnational population estimates (UA, AU), by age and sex, at 30 June 1996, 2001, 2006-16 (2017 boundary)". Statistics New Zealand. 21 October 2016. Retrieved 21 October 2016.
- ↑ "Appendix 2: Rural Area Population Statistics". Ministry of Economic Development. Retrieved 12 April 2011.
- ↑ "QuickStats About Stewart Island". Statistic New Zealand. Retrieved 8 May 2011.
- ↑ "Cook Islands population census 2006" (pdf). Cook Islands Statistics Office. Retrieved 8 May 2011.
- ↑ "2006 Tokelau census of population and dwellings" (pdf). Statistics New Zealand and Office for Council of the Ongoing Government of Tokelau. Retrieved 8 May 2011.
- ↑ "Statistics Niue home page". Statistics Niue. Retrieved 8 May 2011.
- ↑ "QuickStats About Culture and Identity: Pacific Peoples". Statistics New Zealand. Retrieved 8 May 2011.
- ↑ "Biggest Cities in New Zealand". World Atlas. Retrieved 28 August 2016.
- ↑ "Subnational population estimates at 30 June 2010 (boundaries at 1 November 2010)". Statistics New Zealand. 26 October 2010. Archived from the original on 10 June 2011. Retrieved 2 April 2011.
- ↑ "2013 Census totals by topic". Statistics New Zealand. Retrieved 17 March 2014.
- ↑ Socidad Peruana de Medicina Intensiva (SOPEMI) (2000). Trends in international migration: continuous reporting system on migration. Organisation for Economic Co-operation and Development. pp. 276–278.
- ↑ Diggers , Hatters and Whores.p 197-198. Eldred-Grigg. Random House. 2011.
- ↑ Walrond, Carl (21 September 2007). "Dalmatians". Te Ara - the Encyclopedia of New Zealand. Retrieved 30 April 2010.
- ↑ "New Zealand Peoples". Te Ara - the Encyclopedia of New Zealand. Retrieved 30 April 2010.
- ↑ Hoadley, Stephen (2004). "Our immigration policy: rationality, stability, and politics: Stephen Hoadley discusses New Zealand's approach to the vexed question of immigration controls". New Zealand International Review. 29 (2): 14. Retrieved 20 February 2008.
- ↑ "2013 Census QuickStats about culture and identity – data tables". Statistics New Zealand. 15 April 2014. Retrieved 29 January 2016.
- ↑ "Birthplace and people born overseas". 2013 Census QuickStats about culture and identity. Statistics New Zealand. Retrieved 29 August 2014.
- ↑ Butcher, Andrew; McGrath, Terry (2004). "International Students in New Zealand: Needs and Responses" (PDF). International Education Journal. 5 (4).
- ↑ "Requirements for the Skilled Migrant Category". Immigration New Zealand. Retrieved 22 April 2011.
- ↑ "Overview of the Skilled Migrant Category". Immigration New Zealand. Retrieved 30 April 2011.
- 1 2 "New Zealand Work to Residence Visa". New Zealand Visa Bureau. Retrieved 30 April 2011.
- ↑ "Residence from Work – quick check". Immigration New Zealand. Retrieved 25 May 2011.
- ↑ John Bryant and David Law (September 2004). "New Zealand's Diaspora and Overseas-born Population: The diaspora". New Zealand Treasury. Retrieved 10 August 2010.
- ↑ Collins, Simon (March 2005). "Quarter of NZ's brightest are gone". New Zealand Herald.
- ↑ Winkelmann, Rainer (2000). "The labour market performance of European immigrants in New Zealand in the 1980s and 1990s". The International Migration Review. The Center for Migration Studies of New York. 33 (1): 33–58. doi:10.2307/2676011. JSTOR 2676011. Journal subscription required
- ↑ Bain 2006, p. 44.
- ↑ "UK visa options for New Zealand citizens". Visa First Migration Agency.
- ↑ "Ethnic group (detailed single and combination) by age group and sex, for the census usually resident population count, 2013 (RC, TA)". Statistics New Zealand. Retrieved 11 June 2014.
- 1 2 Pool, Ian (July 2012). "'Death rates and life expectancy - Effects of colonisation on Māori'". Te Ara – the Encyclopedia of New Zealand. Retrieved 12 July 2013.
- ↑ "Ethnic groups in New Zealand". 2006 Census QuickStats National highlights. Statistics New Zealand. Retrieved 18 January 2011.
- ↑ "Cultural diversity". 2006 Census QuickStats National highlights. Statistics New Zealand. Retrieved 30 April 2010.
- ↑ "Māori Ethnic Population / Te Momo Iwi Māori". QuickStats About Māori, Census 2006. Statistics New Zealand. Retrieved 30 April 2010.
- ↑ Collins, Simon (October 2010). "Ethnic mix changing rapidly". New Zealand Herald.
- ↑ "QuickStats About Māori:Māori Descent and Iwi / Ko ngā Kāwai Whakaheke Māori me ngā Iwi". Statistics New Zealand. Retrieved 30 April 2011.
- ↑ Clark, Ross (1994). "Moriori and Māori: The Linguistic Evidence". In Sutton, Douglas. The Origins of the First New Zealanders. Auckland: Auckland University Press. pp. 123–135.
- ↑ Davis, Denise (September 2007). "The impact of new arrivals". Te Ara Encyclopedia of New Zealand. Retrieved 30 April 2010.
- ↑ Davis, Denise; Solomon, Māui (March 2009). "'Moriori – The impact of new arrivals'". Te Ara – the Encyclopedia of New Zealand. Retrieved 23 March 2011.
- ↑ Denise Davis and Māui Solomon (4 March 2009). "Moriori – Facts and figures',". Te Ara – the Encyclopedia of New Zealand. Retrieved 22 April 2011.
- 1 2 "2006 Census: QuickStats About Culture and Identity: Ethnic groups in New Zealand". Statistics New Zealand. Retrieved 30 April 2011.
- ↑ Gillian Smeith and Kim Dunstan (June 2004). "Ethnic Population Projections: Issues and Trends". Statistics New Zealand. Retrieved 10 August 2010.
- 1 2 "Ethnic composition of the population". Ministry of Social Development. Retrieved 30 April 2011.
- 1 2 3 "QuickStats About Culture and Identity: Languages spoken". Statistics New Zealand. March 2006. Retrieved 20 February 2008.
- 1 2 Kortmann et al. 2004, p. 605.
- ↑ Hay, Maclagan & Gordon 2008, p. 14.
- ↑ Crystal 2003.
- ↑ Kortmann et al. 2004, p. 582, 589, 592, 610.
- ↑ Trudgill, Peter and Jean Hannah. (2002). International English: A Guide to the Varieties of Standard English, 4th ed. London: Arnold., p 24.
- ↑ Kortmann et al. 2004, p. 611.
- ↑ Crystal 2003, p. 355.
- ↑ Phillips, Jock (March 2009). "The New Zealanders – Bicultural New Zealand". Te Ara – the Encyclopedia of New Zealand. Retrieved 21 January 2011.
- ↑ "Māori Language Week – Te Wiki o Te Reo Maori". Ministry for Culture and Heritage. Retrieved February 2008. Check date values in:
|access-date=(help) - ↑ Squires, Nick (May 2005). "British influence ebbs as New Zealand takes to talking Māori". The Telegraph. Great Britain.
- ↑ "Waitangi Tribunal claim – Māori Language Week". Ministry for Culture and Heritage. July 2010. Retrieved 19 January 2011.
- ↑ "Māori Television Launches 100 percent Māori Language Channel". Māori Television. Retrieved 30 April 2010.
- 1 2 3 "2006 Census Data – QuickStats About Culture and Identity – Tables" (XLS). 2006 Census. Statistics New Zealand. Retrieved 30 April 2010. In tables 28 (Religious Affiliation) and 19 (Languages Spoken by Ethnic Group)
- ↑ "New Zealand Sign Language Act 2006". Office for Disability Issues. Retrieved 30 April 2010.
- ↑ Dyson, Ruth (April 2006). "NZ Sign Language to be third official language". The New Zealand Government. Retrieved 19 January 2011.
- ↑ "Figure 1: Comparing countries' and Economies' performance" (pdf). Programme for International Student Assessment OECD.
- ↑ "Human development indices" (PDF). Human Development Reports. 18 December 2008. Retrieved 16 February 2010.
- 1 2 Dench, Olivia (July 2010). "Education Statistics of New Zealand: 2009". Education Counts. Retrieved 19 January 2011.
- ↑ "Early leaving exemptions". Ministry of Education. Retrieved 6 May 2011.
- 1 2 "Types of school". Ministry of Education website. Retrieved 25 May 2011.
- ↑ "Fees". Ministry of Education. Retrieved 25 May 2011.
- ↑ "The World Factbook – New Zealand". CIA. 15 November 2007. Retrieved 30 November 2007.
- ↑ "Educational attainment of the population" (xls). Education Counts. 2006. Retrieved 21 February 2008.
- ↑ Opie, Stephen (June 2008). Bible Engagement in New Zealand: Survey of Attitudes and Behaviour (PDF). Bible Society of New Zealand. p. 4. Retrieved 29 May 2010.
- ↑ "QuickStats About Culture and Identity: Religious affiliation". Statistics New Zealand. Retrieved 20 January 2011.
- ↑ "QuickStats About Culture and Identity". Statistics NZ Home > Census > 2006 Census Data > About a Subject. Statistics New Zealand (www.stats.govt.nz). Retrieved 29 May 2010.
- ↑ Thomson, Barbara. "Ethnic Diversity in New Zealand: a Statistical Profile" (PDF). Ethnic Affairs Service Information Series. Research Unit, Department of Internal Affairs. 03: 178, 183. ISBN 0-478-09244-X. ISSN 1173-7166. Retrieved 19 September 2009.
- ↑ Wagstrom, Thor (2005). "Broken Tongues and Foreign Hearts". In Brock, Peggy. Indigenous Peoples and Religious Change. Boston: Brill Academic Publishers. pp. 71 and 73. ISBN 978-90-04-13899-5.
- ↑ Table 28, 2006 Census Data – QuickStats About Culture and Identity – Tables.
- ↑ "Quick Stats About culture and Identity— 2006 Census" (PDF). Statistics New Zealand. Retrieved 28 September 2007.
- ↑ "New Zealand Statement on Religious Diversity".
- ↑ "Historical evolution and trade patterns". An Encyclopaedia of New Zealand. 1966. Retrieved 10 February 2011.
- 1 2 Stringleman, Hugh; Peden, Robert (October 2009). "Sheep farming – Importance of the sheep industry". Te Ara – the Encyclopedia of New Zealand. Retrieved 9 May 2011.
- 1 2 "Occupation for the Employed Census Usually Resident Population Count" (xml). Statistics New Zealand. Retrieved 9 May 2011.
- 1 2 "QuickStats About Incomes: Sources of income". New Zealand Statistics. Retrieved 9 May 2011.
- ↑ Evans, N. "Up From Down Under: After a Century of Socialism, Australia and New Zealand are Cutting Back Government and Freeing Their Economies". National Review. 46 (16): 47–51.
- ↑ "Report for Selected Countries and Subjects". International Monetary Fund. October 2010. Retrieved 30 January 2011.
- ↑ "GDP – per capita (PPP)". The World Factbook, Central Intelligence Agency. Retrieved 22 January 2011.
- ↑ "GDP per capita (current US$)". World Bank. Retrieved 22 January 2011.
- ↑ "QuickStats About Incomes: Personal Income". New Zealand Statistics. Retrieved 9 May 2011.
- ↑ "QuickStats About Incomes: Personal Income by Sex". New Zealand Statistics. Retrieved 9 May 2011.
- ↑ "QuickStats About Incomes: Personal income by ethnic group". New Zealand Statistics. Retrieved 9 May 2011.
- ↑ "Unemployment". 2010 Social report. Retrieved 4 February 2011.
- ↑ Bingham, Eugene (7 April 2008). "The miracle of full employment". The New Zealand Herald. Retrieved 17 September 2008.
- ↑ Bascand, Geoff (February 2011). "Household Labour Force Survey: December 2010 quarter – Media Release". Statistics New Zealand. Retrieved 4 February 2011.
- ↑ "Household Labour Force Survey: June 2010 quarter – Media Release". New Zealand Statistics. Retrieved 9 May 2011.
- ↑ "QuickStats About Unpaid Work". New Zealand Statistics. Retrieved 9 May 2011.
- ↑ "QuickStats About Housing: Dwelling ownership". New Zealand Statistics. Retrieved 9 May 2011.
Bibliography
- Bain, Carolyn (2006). New Zealand. Lonely Planet. ISBN 1-74104-535-5.
- Crystal, David (2003). The Cambridge encyclopedia of the English language (2nd ed.). Cambridge University Press. ISBN 978-0-521-53033-0.
- Hay, Jennifer; Maclagan, Margaret; Gordon, Elizabeth (2008). Dialects of English: New Zealand English. Edinburgh University Press. ISBN 978-0-7486-2529-1.
- Kortmann, Bernd; Schneider, Edgar; Burridge, Kate; Mesthrie, Rajend; Upton, Clive (2004). A handbook of varieties of English. Berlin: Mouton de Gruyter. ISBN 978-3-11-017532-5.
| From Africa | ||
|---|---|---|
| From the Americas | ||
| From Asia | ||
| From Europe | ||
| Oceania | ||
| See also | ||