Demographics of Paris
 | ||||
| Île-de-France departments | ||||
| Areas | Population 2008 census | Area | Density | 1999-2008 pop. growth |
| City of Paris (department 75) | 2,211,297 | 105 km2 (41 sq mi) | 20,169/km2 (52,240/sq mi) | +0.45%/year |
| Inner ring (Petite couronne) (Depts. 92, 93, 94) | 4,366,961 | 657 km2 (254 sq mi) | 6,647/km2 (17,220/sq mi) | +0.89%/year |
| Outer ring (Grande couronne) (Depts. 77, 78, 91, 95) | 5,081,002 | 11,250 km2 (4,344 sq mi) | 452/km2 (1,170/sq mi) | +0.68%/year |
| Île-de-France (entire region) | 11,659,260 | 12,012 km2 (4,638 sq mi) | 971/km2 (2,510/sq mi) | +0.71%/year |
| Statistical Areas (INSEE 2008 census) | ||||
| Areas | Population 2008 census | Area | Density | 1999-2008 pop. growth |
| Urban area (Paris agglomeration) | 10,354,675 | 2,844.8 km2 (1,098 sq mi) | 3,640/km2 (9,400/sq mi) | +0.70%/year |
| Metro area (Paris metropolitan area) | 12,089,098 | 17,174.4 km2 (6,631 sq mi) | 704/km2 (1,820/sq mi) | +0.71%/year |
The city of Paris (also called the Commune or Department of Paris) had a population of 2,241,346 people within its administrative city limits as of January 1, 2014.[1] It is surrounded by the Paris unité urbaine, or urban area, the most populous urban area in the European Union. In 2011 the unité urbaine had a population of 10,516,110.[2] The Paris Region, or Île-de-France covers 12,012 square kilometers (4,638 square miles), and has its own regional council and president. It has a population of 12,005,077 as of January 2014, or 18.2 percent of the population of France.[3]
The population of the city of Paris reached a historic high of 2.9 million in 1921 but then declined; between 1954 and 1999 it declined at every census, falling to 2,147,857 in 1999, but after that it began to climb again, reaching 2,234,000 by 2009.[4]
The city's population loss reflected the experience of most other core cities in the developed world that have not expanded their boundaries. The principal factors in the process were a significant decline in household size, and a dramatic migration of residents to the suburbs between 1962 and 1975. Factors in the migration included deindustrialisation, high rent, the gentrification of many inner quarters, the transformation of living space into offices, and greater affluence among working families. The city's population loss was one of the most severe among international municipalities and the largest for any that had achieved more than 2,000,000 residents. Since then an influx of younger residents and immigrants has contributed to the growth of the city.
Density
According to Eurostat, the EU statistical agency, in 2012 the Commune of Paris was the most densely populated city in the European Union, with 21,616 persons per square kilometre within the city limits (the NUTS-3 statistical area), ahead of Inner London West, which had 10,374 persons per square kilometre. According to the same census, three departments bordering Paris, Hauts-de-Seine, Seine-Saint-Denis and Val-de-Marne, had population densities of over ten thousand persons per square kilometre, ranking among the ten most densely populated areas of the EU.[5]
Paris is one of the most densely populated cities in the world.[6] Its density, excluding the outlying woodland parks of Boulogne and Vincennes, was 24,448 inhabitants per square kilometre (63,320/sq mi) in the 1999 official census, which could be compared only with some Asian megapolises and the New York City borough of Manhattan. Even including the two woodland areas, its population density was 20,169/km2 (52,240/sq mi),[7] the fifth-most-densely populated commune in France after Le Pré-Saint-Gervais, Vincennes, Levallois-Perret, and Saint-Mandé—all of which border the city proper.
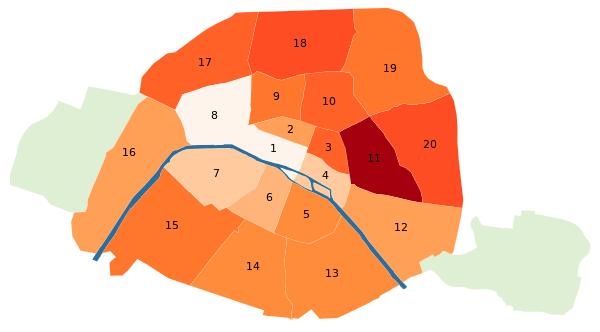
The most sparsely populated quarters are the western and central office and administration-focused arrondissements. The city's population is densest in the northern and eastern arrondissements; the 11th arrondissement had a density of 40,672 inhabitants per square kilometre (105,340/sq mi) in 1999, and some of the same arrondissement's eastern quarters had densities close to 100,000/km2 (260,000/sq mi) in the same year.
|
|
- Notes: Without the Bois de Boulogne and the Bois de Vincennes.
- References: Institut national de la statistique et des études économiques
Paris agglomeration
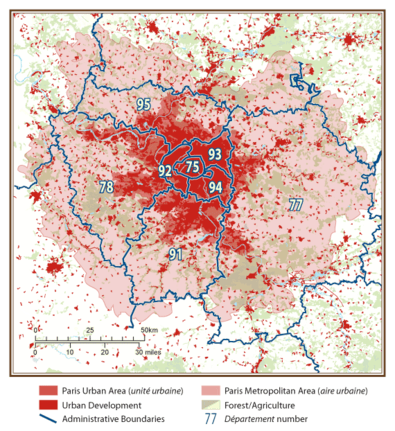
The city of Paris covers an area much smaller than the urban area of which it is the core. At present, Paris's real urbanisation, defined by the pôle urbain (urban area) statistical area, covers 2,845 km2 (1,098 sq mi),[8] or an area about 27 times larger than the city itself. The administration of Paris's urban growth is divided between itself and its surrounding departments: Paris's closest ring of three adjoining departments, or petite couronne ("small ring") are fully saturated with urban growth, and the ring of four departments outside of these, the grande couronne departments, are only covered in their inner regions by Paris's urbanisation. These eight departments form the larger administrative Île-de-France région; most of this region is filled, and overextended in places, by the Paris aire urbaine, which, in 2010, was populated by over 12 million people.[9]
The Paris agglomeration has shown a steady rate of growth since the end of the late 16th century French Wars of Religion, save brief setbacks during the French Revolution and World War II. Suburban development has accelerated in recent years: With an estimated total of 11.4 million inhabitants for 2005, the Île-de-France région shows a rate of growth double that of the 1990s.[10][11]
Immigration
| 2011 Census Paris Region[12][13] | |
|---|---|
| Country/territory of birth | Population |
| 9,112,301 | |
| | 285,703 |
| 240,445 | |
| | 224,787 |
| | 107,549 |
| | 80,265 |
| 74,565 | |
| | 68,703 |
| 59,734 | |
| | 55,443 |
| | 54,525 |
| | 46,486 |
| | 45,870 |
| | 44,356 |
| 41,497 | |
| 39,307 | |
| | 36,538 |
| | 36,008 |
| | 35,495 |
| | 34,702 |
| 32,718 | |
| | 32,270 |
| | 32,017 |
| | 30,824 |
| | 27,373 |
| | 23,334 |
| | 23,232 |
| | 19,769 |
| | 19,646 |
| | 19,583 |
| | 17,723 |
| | 17,596 |
| | 15,483 |
| | 15,312 |
| | 15,146 |
| | 785,821 |
By law, French censuses do not ask questions regarding ethnicity or religion, but do gather information concerning one's country of birth. From this it is still possible to determine that Paris and its metropolitan area is one of the most multi-cultural in Europe: According to the 2011 census, 456,105 residents of the municipality of Paris, or 20.3 percent, and 2,117,901 residents of the Paris Region (Île-de-France), or 17.9 percent, were born outside France.[14] At the 1999 census, 4.2% of the population in Paris metropolitan area were recent immigrants (people who had immigrated to France between 1990 and 1999), the majority from Asia and Africa. 37 per cent of all immigrants in France live in the Paris region.[15]
The first wave of international migration to Paris started as early as 1820 with the arrivals of German peasants fleeing an agricultural crisis in their homeland. Several waves of immigration followed continually until today: Italians and central European Jews during the 19th century; Russians after the revolution of 1917 and Armenians fleeing genocide in the Ottoman Empire;[16] colonial subjects during World War I and later;[17] Poles between the two world wars; Spaniards, Italians, Portuguese, and North Africans from the 1950s to the 1970s; North African Jews after the independence of those countries; Africans and Asians since then.[18]
The Paris metropolitan region or "aire urbaine" is estimated to be home to some 1.7 million Muslims, making up between 10–15 per cent of the area's population. However, without official data, the margin of error of these estimates is extremely high as it is based on one's country of birth (someone born in a Muslim country or born to a parent from a Muslim country is considered as a "potential Muslim").[19] According to the North American Jewish Data Bank, an estimated 310,000 Jews also live in Paris and the surrounding Île-de-France region, an area with a population of 11.7 million inhabitants. Paris has historically been a magnet for immigrants, hosting one of the largest concentrations of immigrants in Europe today.[20]
Immigrants and their children in departments of Île-de-France (Paris Region)
Anch National Institute for Statistics and Economic Studies, responsible for the production and analysis of official statistics in France, 20 per cent of people living in the city of Paris are immigrants and 41.3 per cent of people under 20 have at least one immigrant parent.[21] Among the young people under 18, 12.1 per cent are of Maghrebi origin, 9.9 per cent of Subsaharan African origin and 4.0 per cent of South European origin.[22] About four million people, or 35 per cent of the population of the Île-de-France, are either immigrants (17 per cent) or have at least one immigrant parent (18 per cent).[23]
| Département | Immigrants | Children under 20 with at least one immigrant parent | ||||
|---|---|---|---|---|---|---|
| Number | % department | % Île-de-France | Number | % department | % Île-de-France | |
| Paris (75) | 436'576 | 20 | 22.4 | 162'635 | 41.3 | 15.4 |
| Seine-Saint-Denis (93) | 394'831 | 26.5 | 20.2 | 234'837 | 57.1 | 22.2 |
| Hauts-de-Seine (92) | 250'190 | 16.3 | 12.8 | 124'501 | 34 | 11.8 |
| Val-de-Marne (94) | 234'633 | 18.1 | 12 | 127'701 | 40 | 12.1 |
| Val-d’Oise (95) | 185'890 | 16.1 | 9.5 | 124'644 | 38.5 | 11.8 |
| Yvelines (78) | 161'869 | 11.6 | 8.3 | 98'755 | 26.4 | 9.3 |
| Essonne (91) | 150'980 | 12.6 | 7.7 | 94'003 | 29.6 | 8.9 |
| Seine-et-Marne (77) | 135'654 | 10.7 | 7 | 90'319 | 26 | 8.5 |
| Île-de-France | 1'950'623 | 16.9 | 100 | 1'057'394 | 37.1 | 100 |
(source : Insee, EAR 2006) Reading: 436 576 immigrants live in Paris, representing 20% of Parisians and 22.4% of immigrants in Île-de-France. 162 635 children under 20 with at least one immigrant parent live in Paris, representing 41.3 per cent of the total of children under 20 in Paris and 15.4 per cent of the total of children under 20 with at least one immigrant parent in Île-de-France.
Expatriates
As of 2005 many expatriates settle in the western portion of Paris. Western Paris is in close proximity to many international schools and the La Défense area.[24]
Ethnic groups
Africans
As of 2012 tens of thousands of people of African origins live in Paris. This group includes those born in France who had African parents and naturalized French citizens born in Africa. The majority come from the Maghreb, including Algeria, Morocco, and Tunisia. Other countries with populations in Paris include Burkina Faso, the Congo, Guinea, Mali, and Senegal.[25]
Asians
As of 1998 Île-de-France has half of the Asian population of France.[26] As of 1990 the majority of Asians living in France are ethnic Chinese originating from several countries.[27]
In 1974 France stopped allowing foreign workers into its borders. The Asian population of France increased despite the closure. In 1975 there were 20,000 Asians in Île-de-France. In 1982 the region had 59,000. This increased to 108,000 in 1990.[27]
In France the "Asians" are defined as people originating from the East Asian cultural sphere. The term does not include people from the Indian subcontinent. The usage of "Asians" differs from that of Anglo-Saxon countries.[26]
Geography of the Asian population
For the entire Île-de-France region, there were a total of 108,511 persons who held or formerly held Cambodian, Chinese, Laotian, Taiwanese, and Vietnamese citizenships as of 1990. This included 64,361 current citizens of those countries and 44,150 former citizens who became naturalized as French citizens.[28]
As of 1990, there were a combined total of 31,773 persons who held or formerly held Cambodian, Chinese, Laotian, Taiwanese, and Vietnamese citizenships in the City of Paris. This included 21,655 current citizens of those countries and 10,118 former citizens who became naturalized as French citizens.[28]
As of 1990 fewer than 10,000 persons of East/Southeast Asian origin resided in six communes of Marne-la-Vallée. 26% of the population of Lognes was Asian, and other percentages were 8% in Noisiel, 5-6% in Noisy-le-Grand, and 5-6% in Torcy. In 1982 there were 6,000 Asians in Marne-la-Vallée, making up 3-4% of the area's population. In 1987 the number increased to 9,000.[29]
As of circa 1998 Ivry-sur-Seine and Vitry-sur-Seine had a combined Asian population of 3,600.[30]
As of circa 1998 there were about 6,000 East/Southeast Asians in and around Aulnay-sous-Bois, and there were 3,000 persons of East and Southeast Asian origin in Aulnay proper. Most of them were of Cambodian origin, including those with and without Cambodian citizenship. The commune also had an above-average number of persons of Laotian origin, including those with and without Laotian citizenship. Ethnicities included Khmer people, Lao people, and Overseas Chinese.[30]
Cambodians
As of 1990, in the City of Paris there were 7,950 Cambodian citizens and 3,279 former Cambodian citizens who became naturalized as French. The combined total is 11,229.[28]
That year, in the Île-de-France region there were 26,553 Cambodian citizens and 13,068 former Cambodian citizens naturalized as French. The combined total was 39,421.[28]
Chinese
As of 1990 the majority of Asians living in the Paris area are ethnic Chinese originating from several countries.[27] The largest group includes ethnic Chinese from Indochina, and a smaller group originates from Zhejiang.[31]
Japanese
As of 2013 the official number of Japanese residents in Paris was 16,277.[32]
Laotians
As of 1990, in the City of Paris there were 2,185 Laotian citizens and 1,376 former Laotian citizens naturalized as French, making a combined total of 3,561.[28]
As of that year, in the Île-de-France region there were 10,110 Laotian citizens and 8,177 former Laotian citizens, making a combined total of 18,287.[28]
Vietnamese
In periods before 1975 several Vietnamese arrived in Paris, including intellectuals, those who worked as civil servants in colonial times, and those who came to Paris to study and did not return home. Ethnic Vietnamese arriving after 1975 became a part of an ethnic network established by those that came before them. Many Vietnamese achieved proficiency in the medical, scientific, and computer science fields.[33]
As of 1990, in the City of Paris there were 3,802 Vietnamese citizens and 4,155 former Vietnamese citizens naturalized as French, making a total of 7,957.[28]
As of that year, in the Île-de-France region there were 16,387 Vietnamese citizens and 20,261 former Vietnamese citizens naturalized as French, making a total of 36,648.[28]
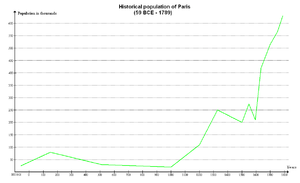
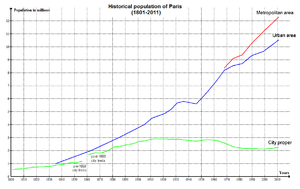
Historical population
Notes for the table:
- until the 1830s, urbanization was contained within the administrative borders of the City of Paris; urban area figures before 1835 are thus the same as the city proper figures
- the phenomenon of long commutes did not appear until the 1960s; metropolitan area figures before 1968 are thus essentially the same as the urban area figures
- time comparisons should be exercised with care, as statistical borders vary year after year. E.g., the metropolitan area figure for 1968 is within the 1968 borders of the metropolitan area, whereas the metropolitan area figure for 1975 is within the 1975 expanded borders of the metropolitan area.
| Gallic population of the city at the start of the Roman conquest of Gaul. | ||||
| Peak of Roman era. | ||||
| Losses after invasions of 3rd and 4th centuries. | ||||
| Lowest point after Viking invasions. | ||||
| Recovery of the High Middle Ages. | ||||
| Blossoming of the 13th century, golden age of King Saint Louis. | ||||
| Losses of the Black Plague and the Hundred Years' War. | ||||
| Renaissance recovery. | ||||
| Losses of religious and civil wars. | ||||
| Spectacular recovery under King Henry IV and Richelieu. | ||||
| Peak of prosperous 18th century. | ||||
| Losses of French Revolution and wars. | ||||
| New city limits; population in 1856 in the new city limits was 1,538,613. | ||||
| Fastest historical growth under Emperor Napoleon III and Haussmann. | ||||
| Temporary stagnation due to the losses of the Siege of Paris during the Franco-Prussian War and the civil war of the Paris Commune and the Third Republic's brutal retribution towards the city. | ||||
| Temporary stagnation due to losses of First World War. | ||||
| Losses of Second World War. | ||||
| Fastest population growth in the 20th century. | ||||
| End of postwar baby boom, end of immigration surplus for Paris; henceforth migration flows from the rest of France become negative, population growth is significantly slower. | ||||
Sources:
| ||||
See also
- Demographics of France
- List of metropolitan areas by population
- Larger urban zone
- Largest urban areas of the European Union
References
- Guillon, Michelle. "The Chinese and Chinese Districts in Paris" (Chapter 11). In: Sinn, Elizabeth (editor). The Last Half Century of Chinese Overseas. Hong Kong University Press, 1 January 1998. ISBN 9622094465, 9789622094468.
Notes
- ↑ "Population of Paris in January 2014". INSEE. Retrieved 4 April 2015.
- ↑ "Unités urbaines de plus de 100 000 habitants en 2011" (in French). INSEE. Retrieved 25 April 2015.
- ↑ INSEE. "Estimation de population au 1er janvier, par région, sexe et grande classe d'âge – Année 2014" (in French). Retrieved 2015-03-29.
- ↑ Institut National de la Statistique et des Études Économiques. "Commune : Paris (75056) – Thème : Évolution et structure de la population" (in French). Retrieved 3 July 2012.
- ↑ "EU population statistics at regional level, Eurostat 2012". Retrieved 3 April 2015.
- ↑ Madge & Willmott 2006, p. 11.
- ↑ "Commune : Paris (75056)" (in French). INSEE. Retrieved 16 June 2013.
- ↑ "La population de l'aire urbaine de Paris augmente de 8,5 % entre 1999 et 2008" (in French). INSEE. Retrieved 20 October 2011.
- ↑ "Aire urbaine 2010 : Paris (001)" (in French). INSEE. Retrieved 3 July 2012.
- ↑ "Enquêtes annuelles de recensement 2004 et 2005" (PDF). INSEE. Retrieved 10 April 2006.
- ↑ "Enquêtes annuelles de recensement: premiers résultats de la collecte 2004" (PDF) (in French). INSEE. Retrieved 10 April 2006.
- ↑ (French) "Fichier Données harmonisées des recensements de la population de 1968 à 2011". INSEE. Retrieved 2014-10-26.
- ↑ (French) "IMG1B - Les immigrés par sexe, âge et pays de naissance (Pays de naissance détaillé)". INSEE. Retrieved 2014-10-26.
- ↑ "INSEE statistics on residents born outside France in 2011" (in French). Retrieved 3 April 2015.
- ↑ "Paris Riots in Perspective". ABC News. 4 November 2005. Retrieved 26 June 2012.
- ↑ Hassell 1991, p. 22.
- ↑ Goebel, Anti-Imperial Metropolis.
- ↑ "Histoire de l'immigration en France" (in French). Cité Nationale de l'Histoire de l'Immigration. Retrieved 25 June 2006.
- ↑ Zarka, Taussig & Fleury 2004, p. 27.
- ↑ Sponsored by (4 December 2008). "Muslims and city politics: When town halls turn to Mecca". Economist.com. Retrieved 26 June 2012.
- ↑ Les immigrés et leur famille en Île-de-France, Note rapide Société, n° 552, June 2011
- ↑ Michèle Tribalat, Les jeunes d'origine étrangère in Revue Commentaire, juin 2009, n°126, p.434
- ↑ Les descendants d'immigrés vivant en Île-de-France, IAU Idf, Note rapide Société, n° 531
- ↑ Lewis, Carol. "How not to get lost in translation: Final 3 Edition." The Times, ISSN 0140-0460, 04/14/2005, p. 10 (of the supplement). "Living: Many expats like to live in western Paris for easy access to the offices of La Defense and the international schools. Renting is the norm and apartments are generally cheaper than those in London."
- ↑ Sealy, Amanda. "African flavor at the heart of Paris." CNN. 8 November 2012. Retrieved on 3 March 2014.
- 1 2 Guillon, p. 186.
- 1 2 3 Guillon, p. 187.
- 1 2 3 4 5 6 7 8 Guillon, p. 188.
- ↑ Guillon, Michelle. "The Chinese and Chinese Districts in Paris" (Chapter 11). In: Sinn, Elizabeth (editor). The Last Half Century of Chinese Overseas. Hong Kong University Press, 1 January 1998. ISBN 9622094465, 9789622094468. CITED: p. 198.
- 1 2 Guillon, Michelle. "The Chinese and Chinese Districts in Paris" (Chapter 11). In: Sinn, Elizabeth (editor). The Last Half Century of Chinese Overseas. Hong Kong University Press, 1 January 1998. ISBN 9622094465, 9789622094468. CITED: p. 197.
- ↑ Guillon, p. 189.
- ↑ Conte-Helm, Marie. The Japanese and Europe: Economic and Cultural Encounters (Bloomsbury Academic Collections). A&C Black, December 17, 2013. ISBN 1-78093-980-9, 9781780939803. p. 81.
- ↑ Guillon, p. 190.
- ↑ The Early Medieval World: From the Fall of Rome to the Time of Charlemagne ...
- ↑ Medieval France.
- 1 2 3 https://journals.lib.byu.edu/spc/index.php/CCR/article/viewFile/13458/13392
- ↑ "Regeneration".
- 1 2 3 "Chiffres clés Évolution et structure de la population – Commune de Paris (75056)". Retrieved 2013-11-02.
- ↑ "Tableau 1 – Unités urbaines de plus de 50 000 habitants" (PDF). p. 5. Retrieved 2011-10-21.
- ↑ "Paris (001-Aire urbaine 90) – E_DEMO – Évolutions démographiques 1982–1999". Retrieved 2011-10-21.
- ↑ "Paris (00851-Unité urbaine 99) – E_DEMO – Évolutions démographiques 1982–1999". Retrieved 2011-10-21.
- ↑ "Paris (001-Aire urbaine 99) – E_DEMO – Évolutions démographiques 1982–1999". Retrieved 2011-10-21.
- ↑ "Chiffres clés Évolution et structure de la population – Unité urbaine 2010 de Paris (00851)". Retrieved 2013-11-02.
- ↑ "Chiffres clés Évolution et structure de la population – Aire urbaine 2010 de Paris (001)". Retrieved 2013-11-02.
Bibliography
- Goebel, Michael. Anti-Imperial Metropolis: Interwar Paris and the Seeds of Third World Nationalism (Cambridge University Press, 2015) excerpts
- Zarka, Yves Charles; Taussig, Sylvie; Fleury, Cynthia (2004). "Les contours d'une population susceptible d'être musulmane d'après la filiation". L'Islam en France (in French). Presses universitaires de France. ISBN 978-2-13-053723-6.
Further reading
- Grzegorczyk, Anna (Faculty of Geography and Regional Studies, University of Warsaw). "Social and ethnic segregation in the Paris metropolitan area at the beginning of the 21st century" (Archive). Miscellanea Geographica – Regional Studies on Development. Vol.17, No.2, 2013. pp. 20–29. ISSN 2084-6118. DOI:10.2478/10288-012-0040-3.