Demographics of Thailand
 Life in Thailand |
|---|
|
The demographics of Thailand paint a statistical portrait of the national population. It includes such measures as population density and distribution, ethnicity, educational levels, public health metrics, fertility, economic status, religious affiliation, and other national characteristics.
Population

The 2014 population of Thailand was estimated to be 67,200,000.[1]
Thailand's population is mostly rural. It is concentrated in the rice growing areas of the central, northeastern, and northern regions. Its urban population—principally in greater Bangkok—was 45.7 percent of the total population in 2010 according to National Economic and Social Development Board (NESDB). Accurate statistics are difficult to arrive at, as millions of Thai migrate from rural areas to cities, then return to their place of origin to help with seasonal field work. Officially they have rural residency, but spend most of the year in urban areas.
Thailand's successful government-sponsored family planning program has resulted in a decline in population growth from 3.1 percent in 1960 to around 0.4 percent in 2015. The World Bank forecasts a contraction of the working-age population of about 10 percent between 2010 and 2040.[2]:4,6 In 1970, an average of 5.7 people lived in a Thai household. At the time of the 2010 census, the figure was down to 3.2. Even though Thailand has one of the better social security systems in Asia, the increasing population of elderly people is a challenge for the country.[2][3]
Life expectancy has risen, a reflection of Thailand's efforts to implement effective public health policies. The Thai AIDS epidemic had a major impact on the Thai population. Today, over 700,000 Thai are HIV or AIDS positive, approximately two percent of adult men and 1.5 percent of adult women. Every year, 30,000–50,000 Thai die from HIV or AIDS-related illnesses. Ninety percent of them are ages 20–24, the youngest range of the workforce. It could have been worse. An aggressive public education campaign begun in the early-1990s reduced the number of new HIV infections from 150,000 to 25,000 annually.
Entirely preventable is the leading cause of death among the age cohort under 15 years of age: drowning. A study by the Child Safety Promotion and Injury Prevention Centre of Ramathibodi Hospital revealed that more than 1,400 youths under 15 years old died from drowning each year, or an average four deaths a day, becoming the top cause of deaths of children, even exceeding that of motorbike deaths. Thailand's Disease Control Department estimates that only 23 percent of Thai children under 15 can swim.[4] The Public Health Ministry said that from 2006 to 2015, 10,923 children drowned. Of the 8.3 million children aged 5–14 nationwide, only two million can swim, according to the Public Health Ministry.[5]
The United Nations classifies Thailand as an "aging society" (one-tenth of the population above 60), on track to become an "aged society" (one-fifth of the population above 60) by 2025. The Fiscal Policy Office projects that the number of Thais aged 60-plus will increase from 14 percent in 2016 to 17.5 percent in 2020, 21.2 percent in 2015, and 25.2 percent in 2030.[6] As of 2016 it is estimated that there are 94,000 employees aged 60 years or more in the workforce.[7]
Ethnic groups
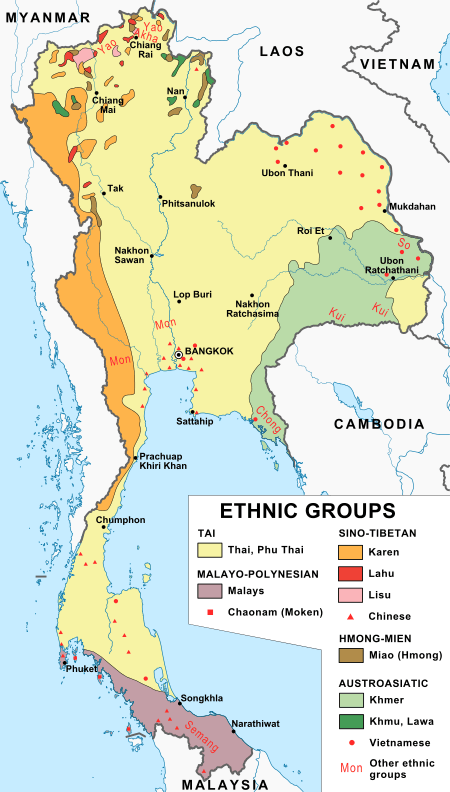
Thailand's ethnic origins are diverse and continue to evolve. The nation's ethnic makeup is obscured by the pressures of Thaification, Thai nationalism, and social pressure, which is intertwined with a caste-like mentality assigning some groups higher social status than others. In its report to the United Nations for the International Convention on the Elimination of All Forms of Racial Discrimination, the Thai government officially recognized 62 ethnic communities.[8]:3 Twenty million Central Thai (together with approximately 650,000 Khorat Thai) make up approximately 20,650,000 million (34.1 percent) of the nation's population of 60,544,937[9] at the time of completion of the Mahidol University Ethnolinguistic Maps of Thailand data (1997).[10]
Thailand's report to the UN provided population numbers for mountain peoples and ethnic communities in the northeast. Thus, though over 3.288 million people in the northeast alone could not be categorised, the population and percentages of other ethnic communities c. 1997 are known and constitute minimum populations. In descending order, the largest (equal to or greater than 400,000) are a) 15,080,000 Lao (24.9 percent) consisting of the Thai Lao[11] (14 million) and other smaller Lao groups, namely the Thai Loei (400-500,000), Lao Lom (350,000), Lao Wiang/Klang (200,000), Lao Khrang (90,000), Lao Ngaew (30,000), and Lao Ti (10,000; b) six million Khon Muang (9.9 percent, also called Northern Thais); c) 4.5 million Pak Tai (7.5 percent, also called Southern Thais); d) 1.4 million Khmer Leu (2.3 percent, also called Northern Khmer); e) 900,000 Malay (1.5%); f) 500,000 Ngaw (0.8 percent); g) 470,000 Phu Thai (0.8 percent); h) 400,000 Kuy/Kuay (also known as Suay) (0.7 percent), and i) 350,000 Karen (0.6 percent).[8]:7-13
There is a significant number of Thai-Chinese in Thailand. Chinese origins as evidenced by surname were erased in the 1920s by royal decree. Fourteen percent of Thais may have Chinese origins.[12] Significant intermixing has taken place such that there are few pure ethnic Chinese, and those of partially mixed Chinese ancestry account for as much as a third to a half of the Thai population. Those assigned Thai ethnicity in the census process made up the vast majority of the population in 2010 (95.9 percent); two percent were Burmese, 1.3 percent other, and 0.9 percent unspecified.[13] Thus, the actual ethnosocial and genetic makeup situation is very different from what is officially reported or self-claimed.
The vast majority of the Isan people, one-third of Thailand's population, are ethnic Lao[11] mixed with Khmer blood. They speak the Isan language. Additionally there have been more recent waves of immigration from Vietnam and Cambodia across porous borders due to wars and subsequent poverty over the last few decades, whose immigrants have tried to keep a low profile and blend in.
In more recent years the Isan people began mixing with the rest of the nation as urbanization and mobility increase. Myanmar's numerous ethnic wars between the army and tribes who speak more than 40 languages and control large fiefdoms or states, has led to waves of immigrants seeking refuge or work in Thailand. The makeup of Myanmar nationals is complex and includes, for example, people of Nepali ethnicity who escaped Nepal, entered Myanmar, and then emigrated to Thailand.
Following the 2014 Thai coup d'état, Thailand's Department of Employment released figures showing that 408,507 legal workers from Myanmar, Laos, and Cambodia worked in Thailand. An additional 1,630,279 Myanmar nationals of all ethnicities, 40,546 Laotians, and 153,683 Cambodians were without legal work authorization, but also worked and resided in Thailand.[14] Some 180,000 Cambodians were said to have left Thailand post-coup due to crackdown rumors, indicating government figures were an under count.[15] These statistics are merely a single snapshot and hardly authoritative as there is constant movement and much eluding of authority.
The language of the central Thai population is the educational and administrative language. Other dialects of Thai exist, most notably the Southern Thai language. Several other small Tai (not Thai) groups include the Shan, Lue, and Phu Thai.
Malay- and Yawi-speaking Muslims of the south are another significant minority group (2.3 percent), yet there are a substantial number of ethnic Malays who speak only Thai. Other groups include the Khmer; the Mon, who are substantially assimilated with the Thai, and the Vietnamese.
Smaller mountain-dwelling tribes, such as the Hmong and Mien, as well as the Karen, number about 788,024. Some 300,000 Hmong were to have received citizenship in 2010.
Thailand is also home to more than 200,000 foreigners—retirees, extended tourists, and workers from, for example, Europe, North America, and elsewhere.[16] Asians tend to be guest or technical workers in Thailand. A number of nationals from China are able to physically blend in after learning Thai claiming to be Thai themselves. Significant numbers of Filipinos work in Thailand due to their English-language skills, as well as technical workers from Japan and Korea. Thousands of Japanese also have retired in Thailand. In recent years there has been a large influx of Russian-speaking retirees and extended-stay tourists in the kingdom.
Languages
Thailand is dominated by languages of the Southwestern Tai family. Karen languages are spoken along the border with Burma, Khmer is spoken near Cambodia (and previously throughout central Thailand), and Malay in the south near Malaysia.
The Thai hill tribes speak numerous small languages, many Chinese retain varieties of Chinese, and there are half a dozen sign languages. Thailand has 73 living languages.[17]
The following table shows official first languages in Thailand with 400,000 or more speakers according to the Royal Thai Government's 2011 Country Report to the Committee Responsible for the International Convention on the Elimination of All Forms of Racial Discrimination.[8]
| Language | Speakers | Language Family |
|---|---|---|
| Central Thai | 20.0 million | Tai-Kadai |
| Lao | 15.2 million | Tai-Kadai |
| Kam Mueang | 6.0 million | Tai-Kadai |
| Pak Tai | 4.5 million | Tai-Kadai |
| Northern Khmer | 1.4 million | Austroasiatic |
| Yawi | 1.4 million | Austronesian |
| Ngaw | 0.5 million | Tai-Kadai |
| Phu Thai | 0.5 million | Tai-Kadai |
| Karen | 0.4 million | Sino-Tibetan |
| Kuy | 0.4 million | Austroasiatic |
The following table employs 2000 census data. Caution should be exercised with Thai census data on first language. In Thai censuses, the four largest Tai-Kadai languages of Thailand (in order, Central Thai, Isan (majority Lao), Kam Mueang, Pak Tai) are not provided as options for language or ethnic group. People declaring one of these as a first language, including Lao, are assigned to "Thai".[18] This explains the disparity between the two tables. For instance, self-reporting as Lao has been prohibited, due to the prohibition of the Lao ethnonym in the context of describing Thai citizens for approximately one hundred years.[19][20] This was due to the promotion of "Thai" national identity to cement Siamese claims over the Lao city-states of what is now northern and northeast Thailand following the 1893 Franco Siamese War and subsequent threats posed by French Indochina to the Lao tributary states of Siam. The birth of a homogenizing Thai ethnocentric national identity sufficient to begin transforming Siam from an absolute monarchy into a modern nation-state was achieved by assimilating the Lao with this Thai "identity", equivalent to what is now known as the Tai–Kadai_languages, under a "Greater Thai Empire", and can be traced back to at least 1902.[21] This homogenization began affecting the Thai census from 1904 onwards. The 2011 UN report data is therefore more comprehensive and better differentiates between the large Tai-Kadai languages of Thailand. As a country submission to a UN convention ratified by Thailand, it is also arguably more authoritative.
| Language | Language family | No. of speakers |
|---|---|---|
| Thai | Tai-Kadai | 52,325,037 |
| Khmer | Austroasiatic | 1,291,024 |
| Malay | Austronesian | 1,202,911 |
| Karen | Sino-Tibetan | 317,968 |
| Chinese | Sino-Tibetan | 231,350 |
| Miao | Hmong-Mien | 112,686 |
| Lahu | Sino-Tibetan | 70,058 |
| Burmese | Sino-Tibetan | 67,061 |
| Akha | Sino-Tibetan | 54,241 |
| English | Indo-European | 48,202 |
| Tai | Tai-Kadai | 44,004 |
| Japanese | Japonic | 38,565 |
| Lawa | Austroasiatic | 31,583 |
| Lisu | Sino-Tibetan | 25,037 |
| Vietnamese | Austroasiatic | 24,476 |
| Yao | Hmong-Mien | 21,238 |
| Khmu | Austroasiatic | 6,246 |
| Indian | Indo-European | 5,598 |
| Haw Yunnanese | Sino-Tibetan | 3,247 |
| Htin | Austroasiatic | 2,317 |
| Others | 33,481 | |
| Unknown | 325,134 | |
| Total | 56,281,538 | |
Religion
Theravada Buddhism is the official religion of Thailand. 93.6 percent are estimated to be Buddhist; 4.9 percent Muslim; 1.2 percent Christian; 0.2 percent other; and 0.1 percent have no religion.[13]
In addition to Malay and Yawi speaking Thai and other southerners who are Muslim, the Muslim Cham of Cambodia in recent years began a large scale influx into Thailand. The government permits religious diversity, and other major religions are represented, though there is much social tension, especially in the Muslim south. Spirit worship and animism are widely practiced.
People with disabilities
According to Thailand's Social Development and Human Security Ministry, about 1.6 million Thais have some form of disability. That amounts to 2.4 percent of the population of 68 million. About half, 48 percent, are physically handicapped. Other disabilities include: hearing loss, 18 percent; visual impairment, 11 percent; mental disorder, seven percent; intellectually challenged, seven percent; autism, 0.54 percent.[23]
Vital statistics
| Year | Population[24] | Live births | Deaths | Natural change | Crude birth rate (per 1000) | Crude death rate (per 1000) | Natural change (per 1000) | Total Fertility Rate | |||||||||
|---|---|---|---|---|---|---|---|---|---|---|---|---|---|---|---|---|---|
| 1983 | 1 055 802 | 252 592 | 803 210 | 21.3 | 5.1 | 16.2 | |||||||||||
| 1984 | 956 680 | 225 282 | 731 398 | 19.0 | 4.5 | 14.5 | |||||||||||
| 1985 | 973 624 | 225 088 | 748 536 | 18.8 | 4.4 | 14.4 | |||||||||||
| 1986 | 945 827 | 218 025 | 727 802 | 18.0 | 4.1 | 13.9 | 2.45 | ||||||||||
| 1987 | 884 043 | 232 968 | 651 075 | 16.5 | 4.3 | 12.2 | 2.35 | ||||||||||
| 1988 | 873 842 | 231 227 | 642 615 | 16.0 | 4.2 | 11.8 | 2.26 | ||||||||||
| 1989 | 905 837 | 246 570 | 659 267 | 16.3 | 4.4 | 11.9 | 2.18 | ||||||||||
| 1990 | 956 237 | 252 512 | 703 725 | 17.0 | 4.5 | 12.5 | 2.11 | ||||||||||
| 1991 | 960 556 | 264 350 | 696 206 | 17.0 | 4.7 | 12.3 | 2.06 | ||||||||||
| 1992 | 57,788,965 | 964 557 | 275 313 | 689 244 | 16.8 | 4.8 | 12.0 | 1.98 | |||||||||
| 1993 | 58,336,072 | 957 832 | 285 731 | 672 101 | 16.5 | 4.9 | 11.6 | 1.93 | |||||||||
| 1994 | 59,095,419 | 960 248 | 305 526 | 654 722 | 16.3 | 5.2 | 11.1 | 1.89 | |||||||||
| 1995 | 59,460,382 | 963 678 | 324 842 | 638 836 | 16.2 | 5.5 | 10.7 | 1.84 | |||||||||
| 1996 | 60,116,182 | 994 118 | 342 645 | 651 473 | 15.8 | 5.7 | 10.1 | 1.81 | |||||||||
| 1997 | 60,816,227 | 897 604 | 303 918 | 593 686 | 14.8 | 5.0 | 9.8 | 1.77 | |||||||||
| 1998 | 61,466,178 | 897 201 | 310 534 | 586 667 | 14.7 | 5.1 | 9.6 | 1.74 | |||||||||
| 1999 | 61,661,701 | 754 685 | 362 607 | 392 078 | 12.3 | 5.9 | 6.4 | 1.71 | |||||||||
| 2000 | 61,878,746 | 773 009 | 365 741 | 407 268 | 12.5 | 5.9 | 6.6 | 1.68 | |||||||||
| 2001 | 62,308,887 | 790 425 | 369 493 | 420 932 | 12.7 | 6.0 | 6.7 | 1.65 | |||||||||
| 2002 | 62,799,872 | 782 911 | 380 364 | 402 547 | 12.5 | 6.1 | 6.4 | 1.61 | |||||||||
| 2003 | 63,079,765 | 742 183 | 384 131 | 358 052 | 11.8 | 6.1 | 5.7 | 1.59 | |||||||||
| 2004 | 61,973,621* | 813 069 | 393 592 | 419 477 | 13.0 | 6.3 | 6.7 | 1.60 | |||||||||
| 2005 | 62,418,054 | 809 485 | 395 374 | 414 111 | 13.0 | 6.4 | 6.6 | 1.56 | |||||||||
| 2006 | 62,828,706 | 793 623 | 391 126 | 402 497 | 12.7 | 6.2 | 6.5 | 1.57 | |||||||||
| 2007 | 63,038,247 | 797 588 | 393 255 | 404 333 | 12.7 | 6.3 | 6.4 | 1.56 | |||||||||
| 2008 | 63,389,730 | 784 256 | 397 326 | 386 930 | 12.4 | 6.3 | 6.1 | 1.53 | |||||||||
| 2009 | 63,525,062 | 765 047 | 393 916 | 371 131 | 12.1 | 6.2 | 5.9 | 1.52 | |||||||||
| 2010 | 63,878,267 | 761 689 | 411 331 | 350 358 | 12.0 | 6.5 | 5.5 | 1.52 | |||||||||
| 2011 | 64,076,033 | 795,031 | 414,670 | 380,361 | 12.4 | 6.5 | 5.7 | 1.53 | |||||||||
| 2012 | 64,456,695 | 801,737 | 415,141 | 386,596 | 12.2 | 6.5 | 5.7 | 1.50 | |||||||||
| 2013 | 64,456,695 | 748,081 | 426,065 | 322,016 | 11.6 | 6.6 | 5.0 | 1.46 | |||||||||
| 2014 | 65,124,716 | 711,081 | 435,624 | 275,457 | 11.9 | 6.9 | 5.0 | 1.41 | |||||||||
| 2015 | 65,729,098 | 736,352 | 456,391 | 279,961 | 11.2 | 6.9 | 4.3 | 1.48 | 1 Sources:[25]:12[26] | ||||||||
Births and deaths
| Period | Live births per year | Deaths per year | Natural change per year | CBR1 | CDR1 | NC1 | TFR1 | IMR1 |
|---|---|---|---|---|---|---|---|---|
| 1950–1955 | 940 000 | 344 000 | 596 000 | 42.5 | 15.6 | 27.0 | 6.14 | 130.3 |
| 1955–1960 | 1 093 000 | 348 000 | 745 000 | 43.0 | 13.7 | 29.3 | 6.14 | 108.7 |
| 1960–1965 | 1 249 000 | 353 000 | 896 000 | 42.3 | 12.0 | 30.3 | 6.13 | 90.5 |
| 1965–1970 | 1 386 000 | 362 000 | 1 025 000 | 40.4 | 10.5 | 29.8 | 5.99 | 75.5 |
| 1970–1975 | 1 371 000 | 355 000 | 1 016 000 | 34.6 | 8.9 | 25.6 | 5.05 | 63.2 |
| 1975–1980 | 1 297 000 | 338 000 | 959 000 | 28.9 | 7.5 | 21.3 | 3.92 | 50.4 |
| 1980–1985 | 1 201 000 | 300 000 | 901 000 | 24.1 | 6.0 | 18.1 | 2.95 | 38.9 |
| 1985–1990 | 1 113 000 | 266 000 | 848 000 | 20.4 | 4.9 | 15.5 | 2.30 | 29.1 |
| 1990–1995 | 1 050 000 | 313 000 | 737 000 | 18.0 | 5.4 | 12.6 | 1.99 | 22.6 |
| 1995–2000 | 955 000 | 373 000 | 582 000 | 15.6 | 6.1 | 9.5 | 1.77 | 18.6 |
| 2000–2005 | 914 000 | 426 000 | 488 000 | 14.1 | 6.6 | 7.5 | 1.68 | 15.1 |
| 2005–2010 | 872 000 | 486 000 | 386 000 | 12.9 | 7.2 | 5.7 | 1.63 | 12.4 |
| 1 CBR = crude birth rate (per 1000); CDR = crude death rate (per 1000); NC = natural change (per 1000); TFR = total fertility rate (number of children per woman); IMR = infant mortality rate per 1000 births. Sources:[27] | ||||||||
Total fertility rate (TFR) in Thailand by region and year:[28]
| Region | 2005-06 | 1995-96 | 1985-86 |
|---|---|---|---|
| Thailand (total) | 1.471 | 2.022 | 2.730 |
| Urban | 1.033 | 1.332 | 1.766 |
| Rural | 1.727 | 2.285 | 2.962 |
| Bangkok Metropolis | 0.878 | 1.261 | 1.735 |
| Central Region[29] | 1.190 | 1.664 | 2.494 |
| Northern Region | 1.575 | 1.894 | 2.248 |
| Northeastern Region | 2.038 | 2.435 | 3.096 |
| Southern Region | 1.524 | 2.851 | 4.049 |
Population pyramids[30]
Estimates (01/07/2012) :
| Age group | Male | Female | Total | % |
|---|---|---|---|---|
| Total | 33 328 645 | 34 583 075 | 67 911 720 | 100 |
| 0-4 | 2 041 071 | 1 938 793 | 3 979 864 | 5.86 |
| 5-9 | 2 353 198 | 2 270 890 | 4 624 088 | 6.81 |
| 10-14 | 2 438 774 | 2 327 414 | 4 766 188 | 7.02 |
| 15-19 | 2 593 629 | 2 473 402 | 5 067 031 | 7.46 |
| 20-24 | 2 673 846 | 2 563 359 | 5 237 205 | 7.71 |
| 25-29 | 2 673 201 | 2 588 947 | 5 262 148 | 7.75 |
| 30-34 | 2 683 015 | 2 637 945 | 5 320 960 | 7.84 |
| 35-39 | 2 673 404 | 2 759 416 | 5 432 820 | 8.00 |
| 40-44 | 2 672 891 | 2 870 531 | 5 543 422 | 8.16 |
| 45-49 | 2 574 423 | 2 769 676 | 5 344 099 | 7.87 |
| 50-54 | 2 315 177 | 2 503 566 | 4 818 743 | 7.10 |
| 55-59 | 1 854 719 | 2 052 030 | 3 906 749 | 5.75 |
| 60-64 | 1 347 251 | 1 534 691 | 2 881 942 | 4.24 |
| 65-69 | 963 728 | 1 154 984 | 2 118 712 | 3.12 |
| 70-74 | 695 434 | 908 033 | 1 603 467 | 2.36 |
| 75-79 | 451 737 | 659 684 | 1 111 421 | 1.64 |
| 80+ | 323 147 | 569 714 | 892 861 | 1.31 |
| Age group | Male | Female | Total | Percent |
|---|---|---|---|---|
| 0-14 | 6 833 043 | 6 537 097 | 13 370 140 | 19.69 |
| 15-64 | 24 061 556 | 24 753 563 | 48 815 119 | 71.88 |
| 65+ | 2 434 046 | 3 292 415 | 5 726 461 | 8.43 |
Data | The World Bank
Life expectancy at birth
- total: 74 years (2011)
- male: 71 years(2011)
- female: 77 years (2011)
Mortality rate, infant (per 1,000 live births)
11 deaths/1,000 live births (2011)
Mortality rate, under-5 (per 1,000 live births)
12 deaths/1,000 live births (2011)
CIA World Factbook demographic statistics
The following demographic statistics are from the CIA World Factbook, unless otherwise indicated.
Population
The population of Thailand is approximately 67.5 million people, with an annual growth rate of about 0.3 percent. In addition to Thais, it includes ethnic Chinese, Malay, Lao, Burmese, Cambodians, and Indians, among others. The 2010 decennial census revealed a population of 65,981,600 (up from 60,916,441 in 2000). Post-census adjustments are being made to lower reporting errors.
Age structure
- 0–14 years: 21.2 percent (male 7,104,776/female 6,781,453)
- 15–64 years: 70.3 percent (male 22,763,274/female 23,304,793)
- 65 years and over: 8.5 percent (male 2,516,721/female 3,022,281) (2008 est.)
- 0–14 years: 19.9 percent (male 6,779,723/female 6,466,625)
- 15–64 years: 70.9 percent (male 23,410,091/female 23,913,499)
- 65 years and over: 9.2 percent (male 2,778,012/female 3,372,203) (2011 est.)
- 0-14 years: 17.41 percent (male 6,062,868/female 5,774,631)
- 15-24 years: 14.78 percent (male 5,119,387/female 4,927,250)
- 25-54 years: 46.69 percent (male 15,675,425/female 16,061,864)
- 55-64 years: 11.26 percent (male 3,600,695/female 4,053,977)
- 65 years and over: 9.86 percent (male 2,935,703/female 3,764,605) (2015 est.)
According to the UN, the proportion of those over 65 will be 19.5 percent in 2030 and 25 percent by 2040.[31]
Population growth rate
- 0.615 percent (2009 est.)
- 0.566 percent (2011 est.)
Net migration rate
0 migrants/1,000 population (2011 est.)
Sex ratio
- At birth: 1.06 males/female
- Under 15 years: 1.05 males/female
- 15–64 years: 0.98 males/female
- 65 years and over: 0.83 males/female
- Total population: 0.98 males/female (2009 est.)
Life expectancy at birth
- Total population: 73.6 years
- Male: 71.24 years
- Female: 76.08 years (2011 est.)
Ethnic groups
The CIA World Factbook lists Thai at 95.9 percent, Burmese 2 percent, others 1.3 percent, unspecified 0.9 percent. While 2 percent Burmese is accurate and reflects mainly illegal migrants, the Thai figure of 95.9 percent figures is not referenced and contradicts more detailed 2011 Royal Thai Government data which suggests ethnic Central Thai 34.1 percent, ethnic Lao[11] 24.9 percent, ethnic Khon Muang 9.9 percent, ethnic Pak Tai 7.4 percent, ethnic Khmer 2.3 percent, ethnic Malay 1.5 percent.[8]
Literacy
- Definition: age 15 and over can read and write
- Total population: 92.6 percent
- Male: 94.9 percent
- Female: 90.5 percent (2002 est.)
References
- ↑ "Thailand Population 2014". World Population Review. Retrieved 2 Mar 2015.
- 1 2 Live Long and Prosper; Aging in East Asia and Pacific (PDF). Washington, DC: World Bank. 2016. ISBN 978-1-4648-0470-0. Retrieved 18 January 2016.
- ↑ Dombrowski, Katja (2013-10-03). "Modernity has arrived". D+C Development and Cooperation. Retrieved 2015-01-05.
- ↑ "More parents send children to learn swimming as drowning topping cause of deaths among youths under 15". ThaiPBS. 2015-03-16. Retrieved 28 Mar 2015.
- ↑ "Water tops child killer list". Bangkok Post. 19 July 2016. Retrieved 19 July 2016.
- ↑ Paweewun, Oranan; Sirimai, Pawee (11 November 2016). "Resetting the economy". Bangkok Post. Retrieved 12 November 2016.
- ↑ Theparat, Chatrudee (15 November 2016). "Somkid presses for Thailand 4.0 labour reforms". Bangkok Post. Retrieved 15 November 2016.
- 1 2 3 4 5 International Convention on the Elimination of All Forms of Racial Discrimination; Reports submitted by States parties under article 9 of the Convention: Thailand (PDF) (in English with appended Thai government translation). United Nations Committee on the Elimination of Racial Discrimination. 28 July 2011. Retrieved 8 October 2016.
- ↑ World Bank Group. (n.d.). Population, total [Thailand]. Washington, DC: Author. http://data.worldbank.org/indicator/SP.POP.TOTL?locations=TH
- ↑ Ethnolinguistic Maps of Thailand (PDF) (in Thai). Office of the National Culture Commission. 2004. Retrieved 8 October 2016.
- 1 2 3 Draper, John; Kamnuansilpa, Peerasit (2016). "The Thai Lao Question: The Reappearance of Thailand's Ethnic Lao Community and Related Policy Questions". Asian Ethnicity. doi:10.1080/14631369.2016.1258300. Retrieved 23 November 2016.
- ↑ Barbara A. West (2009), Encyclopedia of the Peoples of Asia and Oceania, Facts on File, p. 794
- 1 2 "EAST & SOUTHEAST ASIA: THAILAND". The World Factbook. CIA. Retrieved 9 October 2016.
- ↑ "Junta: No crackdown on foreign workers". The Nation. 2014-06-17. Retrieved 9 October 2016.
- ↑ "Thailand, Cambodia to quash 'rumours' after worker exodus". Bangkok Post. Agence France Presse. 2014-06-17. Retrieved 9 October 2016.
- ↑ Bickerstaff, Bruce (Feb 2013). "An Attempt to Quantify the Number of Foreigners Living in Thailand". Burning Bison. Retrieved 1 Mar 2015.
- ↑ "Thailand". Ethnologue. Retrieved 9 October 2016.
- ↑ Luangthongkum, Theraphan. (2007). "The Position of Non-Thai Languages in Thailand". In Lee Hock Guan & L. Suryadinata (eds.), Language, Nation and Development in Southeast Asia (pp. 181-194). Singapore: ISEAS Publishing.
- ↑ Breazeale, Kennon. (1975). The Integration of the Lao States. PhD dissertation, Oxford University.
- ↑ Grabowsky, Volker. (1996). "The Thai census of 1904: Translation and analysis". Journal of the Siam Society, 84(1): 49-85.
- ↑ Streckfuss, D. (1993). "The mixed colonial legacy in Siam: Origins of Thai Racialist Thought, 1890-1910". In L. J. Sears (ed.), Autonomous histories, particular truths: Essays in Honor of John R. W. Smail (pp.123-154). Madison, Wisconsin: University of Wisconsin.
- ↑ Population by language, sex and urban/rural residence, UNSD Demographic Statistics, United Nations Statistics Division, UNdata, last updated 5 July 2013.
- ↑ Karnjanatawe, Karnjana (7 November 2016). "Access for All?". Bangkok Post. Retrieved 7 November 2016.
- ↑ "Population from Registration Record by Sex, 1988-2012". Statistical Yearbook Thailand 2013. National Statistical Office Thailand. Retrieved 17 Feb 2015.
- ↑ Kijsanayotin, Boonchai; Ingun, Pianghatai; Sumputtanon, Kanet (Mar 2003). Review of National Civil Registration and Vital Statistics Systems: A case study of Thailand (PDF). Bangkok: Thai Health Information Standards Development Center (THIS). p. 12. ISBN 978-616-11-1913-3. Retrieved 15 Feb 2015.
- ↑ "4. Vital statistics summary and life expectancy at birth: 2010-2014" (PDF). UNstats. United Nations. Retrieved 26 January 2016.
- ↑ Population Division of the Department of Economic and Social Affairs of the United Nations Secretariat, World Population Prospects: The 2010 Revision. Esa.un.org (2014-04-14). Retrieved on 2014-06-21.
- ↑ http://web.nso.go.th/en/survey/popchan/data/Summary%20Results.pdf
- ↑ excluding Bangkok
- ↑ "Demographic Yearbook". UN Data. United Nations. Retrieved 4 December 2015.
- ↑ Mala, Dumrongkiat (2016-05-28). "Prawase calls for care of ageing society". Bangkok Post. Retrieved 28 May 2016.
External links
| |||||
Thailand articles | |||||||
|---|---|---|---|---|---|---|---|
| History |  | ||||||
| Geography | |||||||
| Politics | |||||||
| Economy | |||||||
| Society |
| ||||||
| |||||||