Demography of Birmingham
| Historical populations | ||
|---|---|---|
| Year | Pop. | ±% |
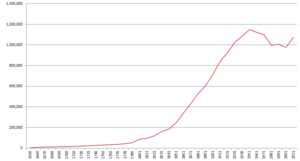
| 1538 | 1,300 | — |
| 1650 | 5,472 | +320.9% |
| 1700 | 15,032 | +174.7% |
| 1731 | 23,286 | +54.9% |
| 1778 | 42,250 | +81.4% |
| 1785 | 52,250 | +23.7% |
| 1801 | 73,670 | +41.0% |
| 1811 | 85,753 | +16.4% |
| 1821 | 106,722 | +24.5% |
| 1831 | 146,986 | +37.7% |
| 1841 | 182,922 | +24.4% |
| 1851 | 232,638 | +27.2% |
| 1861 | 296,076 | +27.3% |
| 1871 | 343,787 | +16.1% |
| 1881 | 400,774 | +16.6% |
| 1891 | 478,113 | +19.3% |
| 1901 | 522,204 | +9.2% |
| 1911 | 525,833 | +0.7% |
| 1921 | 919,444 | +74.9% |
| 1931 | 1,002,603 | +9.0% |
| 1939 | 995,039 | −0.8% |
| 1951 | 1,112,685 | +11.8% |
| 1961 | 1,107,187 | −0.5% |
| 2001 | 977,087 | −11.8% |
| 2011 | 1,074,300 | +9.9% |
| [1][2][3][4] | ||
Birmingham, England is an ethnically and culturally diverse city. The city is the second most populous city in the United Kingdom after London.
Population
Population total
Birmingham city's total population, according to the 2001 UK census, was 977,099. The 2005 estimate for the population of the district of Birmingham was 1,001,200. This is the first time the population has broken the 1,000,000 barrier since 1996.[5] This was a population increase of 0.9% (8,800) from 2004, higher than the 0.6% for the United Kingdom as a whole and 0.7% for England. It is believed to have been caused as a result of increased numbers of births, increased migration and a decrease in deaths in the district.[5] The population of Birmingham is predicted to increase, though it cannot be predicted at certainty due to fluctuations in previous years in migration. The population in Birmingham is predicted to increase by 12.2% (121,500) from 992,100 in 2003 to 1,113,600 in 2028. This is an increase of around 4,000 - 5,000 each year until 2028.[6]
The mid-year population estimates from previous years have showed a general decrease in the population of Birmingham from 1982 to 2002, before beginning to increase again up to 2005, with the increase from 2004 to 2005 being the largest population increase recorded. Though, in total, the overall decline in the population of Birmingham has been by just over 1%. The dependent population (0-14 and 65+) has declined since 2001 as the working population (15-64) has increased.[5]
The ward with the lowest population following the boundary readjustments of 2004 was Ladywood with 14,801.[7] Prior to the boundary readjustments, it had a population of 23,789.[8] The ward with the highest population following the boundary readjustments of 2004 was Sparkbrook with a population of 31,485, which is an increase from 28,311 prior to the boundary adjustments.[9]
Age
Birmingham has a young population compared to England as a whole. The mid-year population estimates of 2005 estimate that Birmingham has a younger age structure compared to England, with a higher proportion of the population of Birmingham being under the age of 34, and lower proportion being above the age of 35, than England.[5][11] In the 20 to 24 year age group, the proportion in Birmingham is about 2% above the national figure.[12]
23.4% of people were aged under 16, 57.7% were aged between 16 and 59, while 18.9% were aged over 60. The average age was 36, compared with 38.6 years for England.[12]
The district of Ladywood was found to have the lowest proportion of people who are 60 years and over than all other districts. Sutton Coldfield district had the highest proportion of people aged 60 years and over. Hodge Hill was found to have the highest population of people from the age of 0 to 15 whilst the districts of Edgbaston and Sutton Coldfield had the lowest.[7]
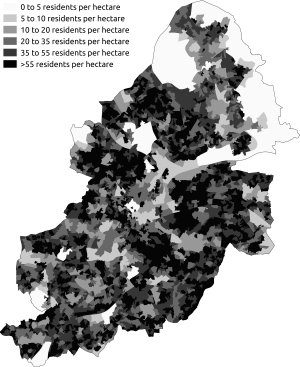
Population density
The population density is 3,649 people per square km compared to the 377.2 people per square km for England. The district of Hall Green had the most persons per acre at 55.22. Sutton Coldfield had the lowest number of persons per acre at 15.47, a difference of 39.75.[13]
Gender
The percentage of the population of Birmingham that were female was higher than the percentage of the population of Birmingham that were male. Females represented 51.6% of the population whilst men represented 48.4%. These percentages are above and below the national, regional and county average respectively.[13] However, the 2005 mid-year estimates recorded that there were more males in the city up to the 35-39 age group. 66% of the population of Birmingham that were aged 80 or over were women, and the population of women who were aged 80 or over was 5% of the Birmingham total, as opposed to 3% for males.[5]
The district of Ladywood had the highest percentage of males in its population at 49.7%, whilst Northfield had the lowest at 47.45%. The ward of Ladywood was the only ward which percentage of males exceeded 50%, with a figure of 50.74%. Shard End had the lowest male population percentage at 46.68%.[13]
Obesity
Birmingham is considered the European Union’s fattest city. 29% of the adult population are classified as obese while the European average is 14%. A quarter of Birmingham's 11- and 12-year-olds are considered obese.[14]
Ethnicity
The following table shows the ethnic group of respondents in the 2001 and 2011 censuses in Birmingham.
| Ethnic Group | 2001[15] | 2011[16] | ||
|---|---|---|---|---|
| Number | % | Number | % | |
| White: British | 641,345 | 65.64% | 570,217 | 53.14% |
| White: Irish | 31,467 | 3.22% | 22,021 | 2.05% |
| White: Gypsy or Irish Traveller[note 1] | 408 | 0.04% | ||
| White: Other | 14,594 | 1.49% | 28,990 | 2.70% |
| White: Total | 687,406 | 70.35% | 621,636 | 57.93% |
| Asian or Asian British: Indian | 55,749 | 5.71% | 64,621 | 6.02% |
| Asian or Asian British: Pakistani | 104,017 | 10.65% | 144,627 | 13.48% |
| Asian or Asian British: Bangladeshi | 20,836 | 2.13% | 32,532 | 3.03% |
| Asian or Asian British: Chinese[note 2] | 5,106 | 0.52% | 12,712 | 1.18% |
| Asian or Asian British: Other Asian | 10,086 | 1.03% | 31,148 | 2.90% |
| Asian or Asian British: Total | 195,794 | 20.04% | 285,640 | 26.62% |
| Black or Black British: Caribbean | 47,831 | 4.90% | 47,641 | 4.44% |
| Black or Black British: African | 6,206 | 0.64% | 29,991 | 2.79% |
| Black or Black British: Other Black | 5,795 | 0.59% | 18,728 | 1.75% |
| Black or Black British: Total | 59,832 | 6.12% | 96,360 | 8.98% |
| Mixed: White and Black Caribbean | 15,644 | 1.60% | 24,720 | 2.30% |
| Mixed: White and Black African | 1,446 | 0.15% | 3,223 | 0.30% |
| Mixed: White and Asian | 6,307 | 0.65% | 11,186 | 1.04% |
| Mixed: Other Mixed | 4,549 | 0.47% | 8,476 | 0.79% |
| Mixed: Total | 27,946 | 2.86% | 47,605 | 4.44% |
| Other: Arab[note 3] | 10,910 | 1.02% | ||
| Other: Any other ethnic group | 6,109 | 0.63% | 10,894 | 1.02% |
| Other: Total | 6,109 | 0.63% | 21,804 | 2.03% |
| Total | 977,087 | 100.00% | 1,073,045 | 100.00% |
Notes for table above
- ↑ New category created for the 2011 census
- ↑ In 2001, listed under the 'Chinese or other ethnic group' heading.
- ↑ New category created for the 2011 census
In 2007, it was estimated[17] 33.3% of Birmingham's population was non-white, whereas London, commonly seen as the most diverse of British cities was 30.4% non-white. This is compared to Liverpool which was only 7.7% non-white. However, there are some smaller towns with larger non-white populations, such as Dewsbury, Batley, or Nelson.
At the time of the 2001 census, 70.4% of the population was White (including 3.22% Irish & 1.49% Other White), 19.5% British Asian, 6.1% Black or Black British, 0.52% Chinese, 2.9% of mixed race and 0.63% of other ethnic heritage.[18] 16.5% of the population was born outside the United Kingdom and 13.42% (131,091) was born outside of the European Union.[19]
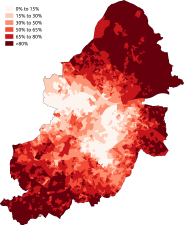
The district with highest percentage of its population being white was Sutton Coldfield at 90.95%.[20] The wards with highest percentage of Birmingham's white population were Quinton, Harborne and Longbridge, Acocks Green, Hall Green, Chelmsley Wood, Smithswood, Kingshurst, Shard End, Castle Vale, Tile Cross, Lea Village, Poolway, Glebe Farm Stechford, Sheldon, Yardley, Kitts Green, Erdington, Bromford, Great Barr, Stockland Green, Kingstanding, Maypole, Warstock, Yardley Wood, Billesley, Kings Norton, Druids Heath, West Heath, Turves Green, Cotteridge, Stirchley, Kings Heath, Moseley, Brandwood, Bartley Green, Woodgate Valley, Rednal, Rubery, Frankley, Weoley Castle, each with 3.4% of the city's total white population. Lozells, Aston, Newtown, Nechells, Ward End, Sparkbrook, Alum Rock, Lee Bank, Highgate, Balsall Heath and Moseley had the lowest percentage of Birmingham's white population with 0.7% of the city's total white population,[21] and also had the highest population of other ethnic minorities at 2.28%.[20]
In research conducted by the University of Manchester, Birmingham is believed to become Britain's second plural city, where no ethnicity forms a majority, in 2024. Leicester is expected to become the first white minority city in 2019. The white ethnic group is still expected to be the largest.[22]
White
There were 679,600 people living in Birmingham, who, according to 2005 estimates,[23] said that they belonged to one of the three White ethnic groups, British, Irish or White 'Other', representing a total of 67.8% of the population. As a percentage share of population, Birmingham ranked at 338 out of 354 English local authorities for people belonging to the White ethnic group. The only two boroughs outside London to rank lower than Birmingham were Slough (56.8%) ranked at 345 and Leicester (62.6%) at 344.[24]
The proportion of white people aged 15 years old or under in Birmingham and England was lower than that of their general populations. The proportion of white people of working age (16 to pensionable age) in Birmingham (60.2%) was higher than the general population in Birmingham (59.8%). Locally (20.7%) and nationally (19.6%), the proportion of white people of pensionable age was higher when compared with their respective general populations in Birmingham (16.7%) and England (18.4%).[24]
Mixed
There were 15,644 people living in Birmingham, who, according to the 2001 Population Census, described their ethnicity as Mixed White & Black Caribbean. As a 1.6% percentage share, Mixed White & Black Caribbean people ranked at 5 (out of 354 English local authorities).[25] There were 1,446 people living in Birmingham, who, according to the 2001 Population Census, described their ethnicity as Mixed White & Black African. As a 0.1% percentage share, Mixed White & Black Africans ranked at 64 (out of 354 English local authorities). The London Borough of Lambeth was ranked at 1 with 0.8% (2,159).[25] There were 6,307 people, who, according to the 2001 Population Census, described their ethnicity as Mixed White & Asian, representing 0.6% of the population of Birmingham and 2.2% of the non-white population. As a percentage share of population, Birmingham ranked at number 34 (out of 354 English local authorities) for people describing their ethnicity as Mixed White & Asian. The London Borough of Westminster ranked at number 1 with 1.3% (2,436).[25] There were 4,549 people of Mixed 'Other' ethnicity living in Birmingham according to the 2001 Population Census, representing 0.5% of the population of Birmingham and 1.6% of the non-white population. As a percentage share of population, Birmingham ranked at number 43 (out of 354 English local authorities) for people describing their ethnicity as Mixed 'Other'. Kensington and Chelsea were ranked at number 1 with 1.4% (2,295).[25]
Asian
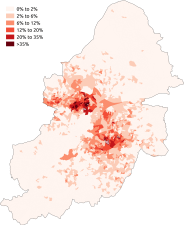
There were a large number of people living in Birmingham, who, according to the 2001 Population Census, said that they belonged to one of the four Asian ethnic groups; Indian, Pakistani, Bangladeshi or Asian 'Other'. This represents 19.5% of the population and 65.8% of the non-white population. As a percentage share of population, Birmingham was ranked at 11 (out of 354 English local authorities) for people belonging to one of the Asian ethnic groups. Outside of the London boroughs only Leicester (29.9%) and Blackburn with Darwen (20.6%) ranked higher at 3 and 10 respectively.[26]
The proportion people aged 15 years and under in Birmingham (34.1%) and England (28.7%) was far higher for Asian people than for their general population populations in Birmingham (23.4%) and England (20.2%). The proportion of people of working age (16 to pensionable age) in Birmingham was similar for Asian people (59.6%) and the general population (59.8%). Nationally the proportion was higher for Asian people at 64.6% compared with 61.5%. Locally at 6.3% and nationally at 6.7% the proportion of people of pensionable age was significantly lower for Asian people than their general populations of Birmingham (16.7%) and England (18.4%).[26]
The 2011 population census recorded that Birmingham had a Pakistani origin population of 140,000; with Small Heath and Alum Rock having the highest Pakistani population in Birmingham and Northfield, the lowest.[20] The highest percentages of Muslims and Asians are found in the east of the city. The neighbourhoods of east Birmingham with the highest percentage of Muslim Asians are Sparkbrook, Sparkhill, Springfield, Small Heath, Saltley, Bordesley Green, Alum Rock, Washwood Heath, Ward End, Greet, Springfield, Hockley, Witton, Aston, Nechells, Duddeston, Highgate and Balsall Heath.
Gypsy and Traveller
Birmingham has a Gypsy and Irish Traveller population of 53,554, making them 5.2% of the total population of the city.[27][28] This population lives mainly in housing and several self-owned caravan sites, most notably in Shipway Road Hay Mills and Castle Vale. The Irish Traveller Movement in Britain has an office based in Victoria Square (Birmingham City Centre),[29] and there is also a law firm on Corporation Street that works solely with this community.[30]
A notable Traveller family, from the Showmen sub-group, is the Wilson family who own and run Bob Wilson's Fairgrounds; they are based in Hay Mills and Brierly Hill.[31] The footballer Freddy Eastwood is from the West Midlands county and is a British Romanichal Gypsy.
Black
There were 59,832 people living in Birmingham, who, according to the 2001 Population Census, said that they belonged to one of the three Black ethnic groups; Black Caribbean, Black African or Black 'Other'. This represents 6.1% of the population and 20.7% of the non-white population. As a percentage share of population Birmingham ranked at 25 (out of 354 English local authorities) for people belonging to one of the Black ethnic groups. Outside of London only Luton (6.3%) ranked higher at 23. Southwark was ranked at 1 with 25.9% (63,416).[32]
The proportion of people aged 15 years or under in Birmingham and England was higher for black people than for their general populations. In Birmingham, the proportion was 24% compared with 23.4% and England 26% compared with 20.2%. The neighbourhoods in North Birmingham with large Black Jamaican and Afro Craibbean population and communitites are Handsworth, Aston, Lozells, Newtown, Nechells, Perry Barr, Winson Green, Birchfield, Soho, Jewellery Quarter Ladywood, Erdington & Bromford, Duddeston, Lee Bank, Edgbaston, Highgate, Balsall Heath, Kings Norton, Druids Heath, Cotteridge, Stirchley and Digbeth Area's in South Birmingham with large black Jamaican and Afro Craibbean population and communities are Highgate, Balsall Heath, Lee Bank, Edgbaston, Ladywood, Moseley, Stirchley, Kings Heath, Cotteridge, Selly Park Kings Norton, Druids Heath Edgbaston and Digbeth. Similarly, the proportion of black people of working age (16 to pensionable age) in Birmingham (62.9%) and England (65.7%) was higher than for the general populations of Birmingham (59.8%) and England (61.5%). Locally at 13.1% and nationally at 8.3% the proportion of people of pensionable age was lower for black people than for their respective general population in Birmingham (16.7%) and England (18.4%).[32] Estimates for Birmingham's Black community are currently thought to be much higher with around 60,000 Jamaicans alone,[33] and 130,000 Afro-Caribbeans in the Birmingham metro area (2005 est).[34]
Chinese
There were 5,106 people of Chinese ethnicity living in Birmingham according to the 2001 Population Census, this represents 0.5% of the population of Birmingham and 1.8% of the non-white population. As a percentage share of population, Birmingham ranked at number 62 (out of 354 English local authorities) for people describing their ethnicity as Chinese. The London borough of Westminster was ranked at number 1 with 2.3% (4,077).[35]
At 15.5%, the proportion of Chinese people aged 15 years old and under was lower than for Chinese people in England (18.2%) and the general populations in Birmingham (23.4%) and England (20.2%). The working age population (16 to pensionable age) was similar for the Birmingham (75.4%) and England (75.3%) Chinese Ethnic groups. This was significantly higher than for the general populations Birmingham (59.8%) and England (61.5%). The proportion of Chinese people of pensionable age in Birmingham (9.1%) and England (6.5%) was much lower than that for the general populations of Birmingham (16.7%) and England (18.4%).[35]
Other
There were 6,109 people living in Birmingham, who, according to the 2001 Population Census, described their ethnicity as 'Other' ethnic group. As a 0.6% percentage share of population, Birmingham was ranked at 41 (out of 354 English local authorities). Of the local authorities ranked above Birmingham only Westminster with 7,426 (4.1%) residents had a greater number of residents.[36]
There were 27.1% of people aged 15 and under from the 'Other' ethnic group, this was higher than for the general population of Birmingham (23.4%). Nationally, the opposite was true, where the proportion of people from the 'Other' ethnic group was 19.2% compared with 20.2% for the general population. The proportion of people in Birmingham (68.6%) from the 'Other' ethnic group of working age (16 to pensionable age) was significantly lower than those from the 'Other' ethnic group in England (76.8%). Both groups were significantly higher than their respective general populations in Birmingham (59.8%) and England (61.5%). The proportion of people of pensionable age from the 'Other' ethnic group in Birmingham (4.3%) and England (4.0%) was much lower than for their respective general populations of 16.7% and 18.4%.[36]
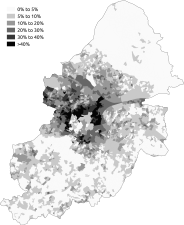
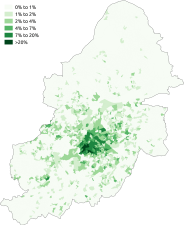
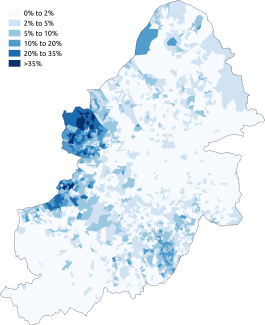
| Distribution of ethnic groups in Birmingham according to the 2011 census. | ||||||||||||||||||||||||||
|---|---|---|---|---|---|---|---|---|---|---|---|---|---|---|---|---|---|---|---|---|---|---|---|---|---|---|
|


Languages
The most common main languages spoken in Birmingham according to the 2011 census are shown below.[37]
| Rank | Language | Usual residents aged 3+ | Proportion |
|---|---|---|---|
| 1 | English | 866,833 | 84.70% |
| 2 | Urdu | 29,403 | 2.87% |
| 3 | Punjabi | 21,166 | 2.07% |
| 4 | Bengali (with Sylheti and Chatgaya) | 14,718 | 1.44% |
| 5 | Pakistani Pahari (with Mirpuri and Potwari) | 10,827 | 1.06% |
| 6 | Polish | 8,952 | 0.87% |
| 7 | Somali | 8,139 | 0.80% |
| 8 | Arabic | 6,921 | 0.68% |
| 9 | Pashto | 6,123 | 0.60% |
| 10 | Gujarati | 4,871 | 0.48% |
| 11 | Persian/Farsi | 3,031 | 0.30% |
| 12 | French | 2,558 | 0.25% |
| 13 | Hindi | 1,540 | 0.15% |
| 14 | Romanian | 1,233 | 0.12% |
| 15 | Cantonese Chinese | 1,198 | 0.12% |
| 16 | Tagalog/Filipino | 1,186 | 0.12% |
| 17 | Portuguese | 1,127 | 0.11% |
| 18 | Tigrinya | 1,074 | 0.10% |
| 19 | German | 1,009 | 0.10% |
| 20 | Tamil | 999 | 0.10% |
| Other | 30,478 | 2.98% |
Religion

In 2001, the main religion in Birmingham was Christianity, as 59.1% (577,783) of the population were Christians. The second largest religion was Islam, adhered to by 14.3%. Meanwhile, 12.4% of the population had no religion.[38] 8.39% (81,959) did not state their religion, above the national average of 7.7%.[39][40]
Birmingham's percentage of Christians is below the national, regional and county average. The percentage of Muslims in Birmingham is above the national, regional and county average, as are the Buddhist (0.3%) and Hindu (1.98%) percentages. The Sikh percentage, 2.93%, is higher than the national and regional percentage, yet below the county figure. The percentage of Jewish population in Birmingham (0.24%) is higher than the regional and county average yet almost half that of the national average.[39]
There were only 21 out of 354 local authorities in England where the proportion of self-described Christians was lower than that of Birmingham. There were only six authorities with a higher percentage of Muslims. Birmingham's total Muslim population of 140,033 was the highest of any local authority area.[40]
The majority of people classifying themselves in one of the White or Black ethnic groups said that they were Christian. At the same time, 29.6% (1,840) Black Africans and 10.8% (1,581) people from the White 'Other' ethnic group said they were Muslim. Over 90% of people in the Bangladeshi and Pakistani groups said they were Muslim. Indian people in the main, said they were Sikh (47.9%) or Hindu (32.7%) . Over 50% of Chinese people said that they had no religion and 18.3% were Buddhist. There were 42.6% (2,605) people from the 'Other' ethnic group who said they were Muslim and 26.6% (1,622) who said they were Christian.[40]
The majority of Christians lived in the north, east and south of Birmingham, on the outskirts of the city, with far fewer living in inner-city areas. 51.7% of Birmingham's Hindu population lived in six wards of the city; Handsworth Wood (2,461), Springfield Sparkhill, Sparkrbook, Small Heath, Alum Rock, Ward End, Saltley, Bordesley Green, Washwood Heath, Stechford (2,023), Erdington, Bromford Lozells and East Handsworth (1,761), Soho (1,699), Hall Green (1,224) and Sparkbrook (845). Almost 65% of Birmingham's Jewish population lived within five wards of Birmingham; Edgbaston (586), Selly Oak (361), Moseley and Kings Heath (321), Bournville (131) and Erdington (104). 71.7% of Birmingham's Muslim population lived in seven wards of Birmingham; Sparkbrook, Sparkhill, Small Heath, Alum Rock, Ward End, Saltley, (19,372), Bordesley Green (18,629), Washwood Heath Stechford, (16,847), Springfield (13,461), Aston (12,381), Lozells and East Handsworth (10,853) and Nechells Erdington, Bromford (8,822), all inner-city wards. The majority of Sikhs were found to live in the west and south east of the city. The ward with the highest proportion of Buddhists was Edgbaston at 1.4% (257).[40]
The following table shows the religion of respondents in the 2001 and 2011 censuses in Birmingham.
| Religion | 2001[41] | 2011[42] | ||
|---|---|---|---|---|
| Number | % | Number | % | |
| Christian | 577,783 | 59.13% | 494,358 | 46.07% |
| Buddhist | 2,977 | 0.30% | 4,780 | 0.45% |
| Hindu | 19,358 | 1.98% | 22,362 | 2.08% |
| Jewish | 2,343 | 0.24% | 2,205 | 0.21% |
| Muslim | 140,033 | 14.33% | 234,411 | 21.85% |
| Sikh | 28,592 | 2.93% | 32,376 | 3.02% |
| Other religion | 2,501 | 0.26% | 5,646 | 0.53% |
| No religion | 121,541 | 12.44% | 206,821 | 19.27% |
| Religion not stated | 81,959 | 8.39% | 70,086 | 6.53% |
| Total | 977,087 | 100.00% | 1,073,045 | 100.00% |
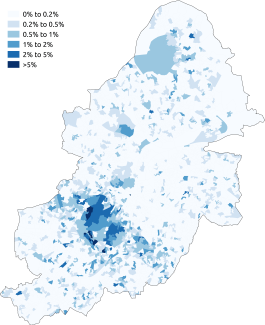
| Distribution of religions in Birmingham according to the 2011 census. | ||||||||||||||||
|---|---|---|---|---|---|---|---|---|---|---|---|---|---|---|---|---|
|


See also
- Demography of the West Midlands
- Religion in Birmingham
- Religion in England
- Demography of the United Kingdom
- Demography of England
- Demography of London
- Demography of Greater Manchester
- List of English cities by population
- List of English districts by population
- List of English districts and their ethnic composition
- List of English districts by area
- List of English districts by population density
References
- ↑ Spencer, Andrew. "Population of Birmingham". Bham.de. Retrieved 6 November 2010.
- ↑ "Historic population of Birmingham". Birmingham City Council. Retrieved 6 November 2010.
- ↑ "Birmingham MB/CB: Historical statistics – Population". A Vision of Britain through Time. University of Portsmouth. 2009. Retrieved 6 November 2010.
- ↑ "Birmingham". Office for National Statistics. Retrieved 6 November 2010.
- 1 2 3 4 5 Birmingham Demographic Briefing: 2005 Sub-National Mid-Year Population Estimate
- ↑ Birmingham City Council: 2003-based Subnational population projections
- 1 2 2001 Population Census: Age structure
- ↑ Birmingham City Council: Ladywood Ward (2001)
- ↑ Birmingham City Council: Sparkbrook ward census information (2001)
- ↑ "A Vision of Britain through time, Population Statistics, University of Portsmouth, Birmingham District through time: Total Population". Retrieved 15 July 2013.
- ↑ Birmingham City Council: Comparison of Birmingham and England Age Structure 2005
- 1 2 Birmingham City Council: Census 2001 - About Birmingham
- 1 2 3 2001 Population Census: Usual resident population
- ↑ Birmingham is Obesity Capital of Europe
- ↑ "2001 census - theme tables". NOMIS. Retrieved 5 September 2014.
- ↑ "QS201EW - Ethnic group". NOMIS. Retrieved 8 August 2015.
- ↑ "Resident Population Estimates by Ethnic Group (Percentages)". National Neighbourhood Statistics. June 2007. Retrieved 2010-08-16.
- ↑ Ethnicity of Birmingham (2001)
- ↑ 2001 Population Census: Country of Birth
- 1 2 3 Birmingham City Council: Ethnic group
- ↑ 2001 Population Census: White population
- ↑ Gaines, Sara (2007-09-11). "Leicester heads for diversity milestone". London: Guardian Unlimited. Retrieved 2010-05-01.
- ↑ "Resident Population Estimates by Ethnic Group, All Persons". National Neighbourhood Statistics. June 2007. Retrieved 2010-08-16.
- 1 2 2001 Population Census: White Groups
- 1 2 3 4 2001 Population Census: Mixed Groups
- 1 2 2001 Population Census: Asian Groups
- ↑ Oxford English Dictionary Second Edition 1989, "Romany3, n. and a."
- ↑ http://www.irishtraveller.org.uk/images/providing_traveller_sites.pdf
- ↑ http://www.irishtraveller.org.uk/about-us/contact-us/
- ↑ http://www.travellersschool.org.uk/links.php
- ↑ ?http://www.funfairs.net/
- 1 2 2001 Population Census: Black Groups
- ↑ Equality and Human Rights Commission - home page
- ↑ Neighbourhood Statistics
- 1 2 2001 Population Census: Chinese or 'Other' Group - Chinese
- 1 2 2001 Population Census: Chinese or 'Other' Group - 'Other' Ethnic Group
- ↑ "Download:local authorities: county / unitary". NOMIS. Retrieved 5 September 2014.
- ↑ 2001 Population Census in Birmingham: Religious profiles
- 1 2 2001 Population Census: Religion in Birmingham City Council wards
- 1 2 3 4 2001 Population Census: Religious Profiles
- ↑ "2001 census - theme tables". Retrieved 5 September 2014.
- ↑ "Download:local authorities: county / unitary". NOMIS. Retrieved 2 September 2014.
| History |  | |
|---|---|---|
| Geography | ||
| Government | ||
| Culture | ||