East Coast (New Zealand electorate)
East Coast is a New Zealand parliamentary electorate, returning one Member of Parliament to the House of Representatives of New Zealand. The electorate first existed from 1871 to 1893, and was recreated in 1999. The current MP for East Coast is Anne Tolley of the National Party, who has held office since 2005.[1]
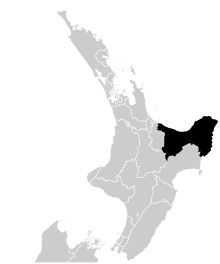
Population centres
The electorate's main centres are Gisborne (32,529) and Tolaga Bay in the Gisborne Region; and Opotiki and Whakatane (18,800) in the eastern part of the Bay of Plenty Region. Wairoa, the northernmost town in the Hawke's Bay region, was excluded by the 2007 boundary changes.
History
The East Coast electorate was first established for the 5th Parliament in 1871.[2] William Kelly was the first elected representative; he held the seat until the end of the term in 1875.[3]
The "most sensational electoral contest ever held in the East Coast" electorate was held in January 1876, when mysterious pieces of cardboard were distributed by supporters of George Read in Gisborne, which hotel bars accepted as legal tender. Read, George Morris and Kelly received 215, 206 and 185 votes, with another candidate coming a distant fourth. Morris petitioned against Read's election. A parliamentary committee of enquiry determined that Read had not broken any laws by approving the initiative, but the House of Representatives resolved that Read was to be unseated in favour of Morris, which happened later in 1876.[4][5] This was the last election enquiry held by a parliamentary committee. Subsequently, these enquiries were held by the courts.[6]
At the next election in 1879, Morris was defeated by Allan McDonald, who held the electorate until he resigned in 1884.[7]
Samuel Locke won the resulting by-election and was confirmed a few months later at the 1884 general election. He served until the end of the term of the 9th Parliament in 1887.[8]
Andrew Graham won the 1887 general election. He resigned in 1889 before the end of the term.[9] Alexander Creighton Arthur won the resulting 1889 by-election. Arthur and Kelly (the electorate's first representative in 1871) contested the 1890 general election, and Kelly was successful by a small margin, with 1022 to 1008 votes in his favour.[10] He served until the end of the term in 1893,[3] after which the electorate was abolished, and was replaced by the Bay of Plenty and Waiapu electorates.
Members of Parliament
From 1871 to 1893, the electorate was represented by seven Members of Parliament. When the electorate was abolished the then current MP, William Kelly contested and won the new seat of Bay of Plenty. In 1999, the electorate was recreated from most of the Mahia, and part of the Bay of Plenty electorates. Since 1999 it has been represented by two MPs.
Key
Independent Liberal Labour National United Future Green
| Election | Winner | |
|---|---|---|
| 1871 election | William Kelly | |
| 1876 election | George Read | |
| George Morris1 | ||
| 1879 election | Allan McDonald | |
| 1881 election | ||
| 1884 by-election | Samuel Locke | |
| 1884 election | ||
| 1887 election | Andrew Graham | |
| 1889 by-election | Alexander Creighton Arthur | |
| 1890 election | William Kelly | |
| electorate abolished, 1893-1999 | ||
| 1999 election | Janet Mackey | |
| 2002 election | ||
| 2005 election | Anne Tolley | |
| 2008 election | ||
| 2011 election | ||
| 2014 election | ||
1 See History section above.
List MPs
The following table lists Members of Parliament elected from party lists in elections where that person also unsuccessfully contested the East Coast electorate. Unless otherwise stated, all MPs terms began and ended at general elections.
| Election | Winner | |
|---|---|---|
| 2002 election | Judy Turner | |
| 2005 election | Moana Mackey | |
| Judy Turner | ||
| 2008 election | Catherine Delahunty | |
| Moana Mackey | ||
| 2011 election | Moana Mackey | |
Election results
2014 election
| General election, 2014: East Coast[11] | |||||||||
|---|---|---|---|---|---|---|---|---|---|
|
Notes: Green background denotes the winner of the electorate vote.
| |||||||||
| Party | Candidate | Votes | % | ±% | Party Votes | % | ±% | ||
| National | |
18,074 | 51.92 | +3.65 | 17,152 | 48.42 | −1.35 | ||
| Labour | Moana Mackey | 10,140 | 29.13 | −2.69 | 8,022 | 22.64 | −1.23 | ||
| Green | Gavin Maclean | 2,679 | 7.70 | −0.75 | 3,248 | 9.17 | −1.43 | ||
| NZ First | Mere Takoko | 2,485 | 7.14 | +3.06 | 4,176 | 11.79 | +3.26 | ||
| Conservative | Rick Drayson | 784 | 2.25 | −2.41 | 1,438 | 4.06 | +1.04 | ||
| Internet | Patrick Salmon | 259 | 0.74 | +0.74 | |||||
| Democrats | Harry Alchin Smith | 86 | 0.25 | +0.25 | 30 | 0.08 | +0.05 | ||
| Internet Mana | 413 | 1.17 | +0.42[lower-alpha 1] | ||||||
| Māori | 334 | 0.94 | −0.11 | ||||||
| Legalise Cannabis | 150 | 0.42 | −0.03 | ||||||
| Ban 1080 | 122 | 0.34 | +0.34 | ||||||
| ACT | 82 | 0.23 | −0.71 | ||||||
| United Future | 78 | 0.22 | −0.69 | ||||||
| Independent Coalition | 17 | 0.05 | +0.05 | ||||||
| Civilian | 13 | 0.04 | +0.04 | ||||||
| Focus | 4 | 0.01 | +0.01 | ||||||
| Informal votes | 305 | 148 | |||||||
| Total Valid votes | 34,812 | 35,427 | |||||||
| Turnout | 35,575 | 76.69 | +2.16 | ||||||
| National hold | Majority | 7,934 | 22.79 | +6.33 | |||||
2011 election
| General Election 2011: East Coast[12] | |||||||||
|---|---|---|---|---|---|---|---|---|---|
|
Notes: Green background denotes the winner of the electorate vote.
| |||||||||
| Party | Candidate | Votes | % | ±% | Party Votes | % | ±% | ||
| National | |
14,003 | 48.27 | -4.18 | 14,804 | 49.77 | +2.15 | ||
| Labour | Moana Mackey | 9,229 | 31.82 | -0.21 | 7,101 | 23.87 | -7.78 | ||
| Green | Darryl Monteith | 2,452 | 8.45 | +3.09 | 3,154 | 10.60 | +4.24 | ||
| Conservative | Kathy Sheldrake | 1,352 | 4.66 | +4.66 | 898 | 3.02 | +3.02 | ||
| NZ First | Tamati Reid | 1,184 | 4.08 | -2.76 | 2,538 | 8.53 | +2.68 | ||
| United Future | Martin Gibson | 392 | 1.35 | -1.96 | 271 | 0.91 | -1.28 | ||
| Mana | Val Irwin | 256 | 0.88 | +0.88 | 224 | 0.75 | +0.75 | ||
| ACT | John Norvill | 140 | 0.48 | +0.48 | 280 | 0.94 | -1.62 | ||
| Legalise Cannabis | 133 | 0.45 | +0.14 | ||||||
| Māori | 313 | 1.05 | -0.38 | ||||||
| Alliance | 10 | 0.03 | -0.03 | ||||||
| Democrats | 10 | 0.03 | -0.004 | ||||||
| Libertarianz | 9 | 0.03 | -0.01 | ||||||
| Informal votes | 616 | 233 | |||||||
| Total Valid votes | 29,008 | 29,976 | |||||||
| National hold | Majority | 4,774 | 16.46 | -3.98 | |||||
Electorate (as at 21 October 2011): 40,533[13]
2008 election
| General Election 2008: East Coast[14] | |||||||||
|---|---|---|---|---|---|---|---|---|---|
|
Notes: Green background denotes the winner of the electorate vote.
| |||||||||
| Party | Candidate | Votes | % | ±% | Party Votes | % | ±% | ||
| National | |
16,463 | 52.46 | +7.65 | 15,160 | 47.63 | +5.43 | ||
| Labour | Moana Mackey | 10,050 | 32.02 | -8.78 | 10,075 | 31.65 | -7.34 | ||
| NZ First | Brendan Horan | 2,147 | 6.84 | +3.35 | 1,862 | 5.85 | -0.92 | ||
| Green | Catherine Delahunty | 1,684 | 5.37 | +1.75 | 2,025 | 6.36 | +2.11 | ||
| United Future | Judy Turner | 1,040 | 3.31 | -0.57 | 698 | 2.19 | -0.76 | ||
| ACT | 816 | 2.56 | +1.87 | ||||||
| Māori | 457 | 1.44 | -0.16 | ||||||
| Progressive | 199 | 0.63 | -0.37 | ||||||
| Bill and Ben | 175 | 0.55 | - | ||||||
| Kiwi | 115 | 0.36 | - | ||||||
| Legalise Cannabis | 99 | 0.31 | +0.12 | ||||||
| Family Party | 83 | 0.26 | - | ||||||
| Alliance | 19 | 0.06 | +0.00 | ||||||
| Libertarianz | 13 | 0.04 | +0.02 | ||||||
| Democrats | 12 | 0.04 | -0.03 | ||||||
| Workers Party | 10 | 0.03 | - | ||||||
| Pacific | 7 | 0.02 | - | ||||||
| RONZ | 5 | 0.02 | +0.01 | ||||||
| RAM | 2 | 0.01 | - | ||||||
| Informal votes | 246 | 130 | |||||||
| Total Valid votes | 31,384 | 31,832 | |||||||
| National hold | Majority | 6,413 | 20.43 | +16.44 | |||||
2005 election
Note: lines coloured beige denote the winner of the electorate vote. Lines coloured pink denote a candidate elected to Parliament from their party list.
| Party | Candidate | Votes | % | Party Votes | % |
| National | | 13,666 | 44.80 | 13,070 | 42.20 |
| Labour | Moana Mackey | 12,447 | 40.81 | 12,076 | 38.99 |
| United | Judy Turner | 1,186 | 3.89 | 916 | 2.96 |
| Green | Catherine Delahunty | 1,104 | 3.62 | 1,316 | 4.25 |
| NZ First | Joe Glenn | 1,064 | 3.49 | 2,098 | 6.77 |
| Māori Party | John Harré | 589 | 1.93 | 494 | 1.59 |
| Destiny | Bill Sadler | 446 | 1.46 | 336 | 1.08 |
| Progressive | - | - | - | 309 | 1.00 |
| ACT | - | - | - | 214 | 0.69 |
| ALCP | - | - | - | 60 | 0.19 |
| Christian Heritage | - | - | - | 20 | 0.06 |
| Democrats | - | - | - | 20 | 0.06 |
| Alliance | - | - | - | 17 | 0.05 |
| Family Rights PP | - | - | - | 8 | 0.03 |
| Libertarianz | - | - | - | 6 | 0.02 |
| 99 MP | - | - | - | 5 | 0.02 |
| One NZ | - | - | - | 3 | 0.01 |
| Direct Democracy | - | - | - | 2 | 0.01 |
| Republic of NZ | - | - | - | 2 | 0.01 |
| informal votes | 266 | 125 | |||
| total valid votes | 30,502 | 30,972 | |||
| National gain from Labour | Majority | 1,219 | |||
sourced from electionresults.govt.nz
1890 election
| Party | Candidate | Votes | % | ± | |
|---|---|---|---|---|---|
| Liberal | William Kelly | 1,022 | 50.34 | ||
| Conservative | Alexander Creighton Arthur | 1,008 | 49.65 | ||
| Majority | 14 | 0.68 | |||
| Turnout | 2,030 | 68.65 | |||
| Registered electors | 2,957 | ||||
Table footnotes
Notes
- ↑ New Zealand Parliament - Anne Tolley MP
- ↑ Scholefield 1950, p. 157.
- 1 2 Scholefield 1925, p. 107.
- ↑ "East Coast (New Zealand electorate)". Dictionary of New Zealand Biography. Ministry for Culture and Heritage.
- ↑ "East Coast Election Report". Daily Southern Cross, Volume XXXII, Issue 5261. 23 August 1876. p. 3. Retrieved 4 September 2011.
- ↑ Mackay 1949, p. 354.
- ↑ Scholefield 1925, p. 111.
- ↑ Scholefield 1925, p. 110.
- ↑ Scholefield 1925, p. 96.
- ↑ Mackay 1949, p. 355.
- ↑ New Zealand Electoral Commission (10 October 2014). "Official Count Results – East Coast". Retrieved 28 January 2016.
- ↑ East Coast results, 2011
- ↑ "Enrolment statistics". Electoral Commission. 21 October 2011. Retrieved 28 October 2011.
- ↑ Election result: East Coast, 2008
- ↑ "The General Election, 1890". National Library. 1891. Retrieved 25 February 2012.
References
- Mackay, Joseph Angus (1949). Historic Poverty Bay and the East Coast, N.I., N.Z. Gisborne: Joseph Angus Mackay. Retrieved 25 September 2010.
- Scholefield, Guy (1950) [First ed. published 1913]. New Zealand Parliamentary Record, 1840–1949 (3rd ed.). Wellington: Govt. Printer.
- Scholefield, Guy (1925) [First ed. published 1913]. New Zealand Parliamentary Record (2nd ed.). Wellington: Govt. Printer.
External links
- Electorate Profile Parliamentary Library