Economy of the Arab League
| Part of a series on |
| Arab League |
|---|
|
Issues |
|
|
Weapons of mass destruction |
|---|
|
|
|
|
|
|
|
|
|
|
|
|
|
|
|
|
|
|
|
|
|
|
The Arab League is rich in resources, with enormous oil and natural gas reserves. The region's instability has not affected its tourism industry, which is considered the fastest growing sector in the region, with Egypt, the UAE, Lebanon, Saudi Arabia and Jordan leading the way. Another industry that is growing steadily in the Arab League is telecommunications. Within less than a decade, local companies such as Orascom and Etisalat have managed to successfully compete internationally as global power players.
Economic achievements among member states have been low in the League's history. Other smaller Arab organizations, such as the GCC, have achieved more than the League has. However, lately there has emerged several major economic projects that slated to be completed soon that appear promising. Of these, the Arab Gas Pipeline, a project which hopes to funnel Egyptian and Iraqi gas to Jordan, Syria and Lebanon, and then to Turkey and Europe, is scheduled to reach completion by the year 2010. The GAFTA free trade agreement is to be completed by the January 1, 2008, effectively rendering 95% of all Arab products free of customs tax.
The economic development in the Arab League exhibits a great diversity. There is a significant difference between, on the one hand, the rich oil states of the UAE, Qatar, Kuwait, and Saudi Arabia, and on the other hand, the poor countries like the Comoros, Mauritania and Djibouti. For instance, the GDP per capita of the wealthiest Arab Country and the wealthiest in the world, Qatar, is 73 times higher than that of Mauritania.[1][2]
Free trade agreements
List of member states by GDP (PPP)
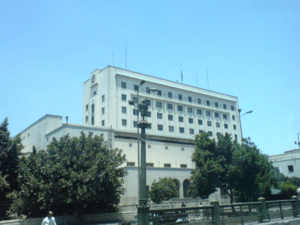
Arab League HQ building in Cairo, Egypt
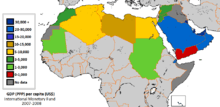
Arab League members depending on the GDP PPP
This following table lists the gross domestic product (GDP) of the Arab League and its member states based on purchasing power parity (PPP) and measured in US dollars. If not indicated otherwise, the figures are based on the 2012 data published by the International Monetary Fund.[3]
| Country | GDP (PPP) US$B | GDP (PPP) US$ per capita |
|---|
 Arab League Arab League | 5,990.66 | 7,981 |
 Saudi Arabia Saudi Arabia | 1605.7 | 31,275 |
 Egypt Egypt | 943.1 | 6,545 |
 Algeria Algeria | 551.8 | 7,477 |
 United Arab Emirates United Arab Emirates | 599.8 | 49,012 |
 Qatar Qatar | 320.5 | 102,211 |
 Morocco Morocco | 287.1 | 5,265 |
 Kuwait Kuwait | 284 | 39,889 |
 Iraq Iraq | 522.7 | 7,200 |
 Syria Syria | 121.4 | 5,041 |
 Tunisia Tunisia | 124.3 | 9,775 |
 Oman Oman | 172.8 | 29,166 |
 Libya Libya | 97.6 | 12,066 |
 Sudan Sudan | 159.1 | 2,545 |
 Lebanon Lebanon | 81.1 | 15,757 |
 Yemen Yemen | 103.6 | 2,283 |
 Jordan Jordan | 79.6 | 6,042 |
 Bahrain Bahrain | 61.9 | 28,744 |
 Palestine Palestine | 8.8 | 2,900 |
 Mauritania Mauritania | 15 | 2,122 |
 Somalia Somalia | 5.86 | 547 |
 Djibouti Djibouti | 2.8 | 2,677 |
 Comoros Comoros | 1.4 | 1,258 |
| Country/Organization | GDP (PPP) US$B | GDP (PPP) US$ per capita |
|---|
| World | 82,762 | 11,975 |
 European Union European Union | 16,073 | 32,021 |
 United States United States | 15,653 | 49,922 |
 People's Republic of China People's Republic of China | 12,383 | 9,162 |
| Arab League | 5,990 | 7,981 |
 India India | 4,711 | 3,830 |
 Japan Japan | 4,617 | 36,266 |
 Germany Germany | 3,194 | 39,028 |
Notes:
- ^a The IMF source does not provide data for the compound Arab League. The total GDP figure has been calculated as the sum of the GDPs of the member states. The per capita value is derived on the basis of the population stated in the infobox.
- ^b The IMF source does not provide data for this country. The reported figures are taken from a 2007 estimate of the CIA published in the CIA factbook.[4] For Palestine, a 2006 estimate was retrieved from the same source which is published as "West Bank (includes Gaza Strip)".
References
External links
|
|---|
|
 Arab League Arab League Lists Lists Portal Arab world Portal Arab world
|
|
| Politics | | |
|---|
|
| Membership | | Members | |
|---|
| | Observers | |
|---|
| | Suspended | |
|---|
| | Candidates | |
|---|
|
|---|
|
| Diplomacy | |
|---|
|
| Life | |
|---|
|
|