Electoral history of Charles Rangel
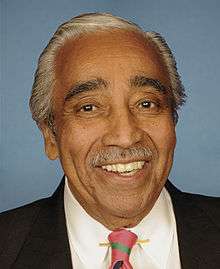
Representative Charles Rangel
This is the Electoral history of Charles Rangel, a Democratic Representative from New York City, representing the 18th, 19th, 16th, 15th districts, and 13th districts. Rangel was first elected in November 1970, and was re-elected in every subsequent election. He is currently the second most senior United States Representative. Retiring in January 2017, he did not file to run in the 2016 House elections.
New York's 19th congressional district: Results 1972–1980[1][2]
| Year |
|
Subject |
Party |
Votes |
% |
|
Opponent |
Party |
Votes |
% |
|
Opponent |
Party |
Votes |
% |
|---|
| 1972 |
|
Charles Rangel |
Democratic, Republican, Liberal |
104,427 |
96% |
|
Marshall Dodge |
Conservative |
2,517 |
1% |
|
Jose Stevens |
Communist |
843 |
1% |
| 1974 |
|
Charles Rangel |
Democratic, Republican, Liberal |
63,146 |
97% |
|
Charles Mills |
Conservative |
2,039 |
3% |
|
|
|
|
|
| 1976 |
|
Charles Rangel |
Democratic, Republican, Liberal |
91,672 |
97% |
|
Benton Cole |
Conservative |
2,169 |
2% |
|
Helen Halyard |
Workers |
640 |
1% |
| 1978 |
|
Charles Rangel |
Democratic, Republican, Liberal |
91,672 |
96% |
|
F. Freeman Yearling |
Conservative |
1,648 |
3% |
|
Kenneth Miliner |
Socialist Workers |
612 |
0% |
| 1980 |
|
Charles Rangel |
Democratic, Republican, Liberal |
84,062 |
96% |
|
Marjorie Garvey |
Conservative, Right to Life |
2,622 |
3% |
|
Reba Dixon |
Socialist Workers |
692 |
1% |
New York's 16th congressional district: Results 1982–1990[1][2]
| Year |
|
Subject |
Party |
Votes |
% |
|
Opponent |
Party |
Votes |
% |
|
Opponent |
Party |
Votes |
% |
|---|
| 1982 |
|
Charles Rangel |
Democratic, Republican, Liberal |
76,626 |
97% |
|
Michael Berns |
Conservative |
1,261 |
2% |
|
Veronica Cruz |
Socialist Workers |
718 |
1% |
| 1984 |
|
Charles Rangel |
Democratic, Republican |
117,759 |
97% |
|
Michael Berns |
Conservative |
2,541 |
2% |
|
Nan Bailey |
Socialist Workers |
1,098 |
1% |
| 1986 |
|
Charles Rangel |
Democratic, Republican, Liberal |
61,262 |
96% |
|
Michael Berns |
Conservative |
1,288 |
2% |
|
William Seraile |
New Alliance |
995 |
2% |
| 1988 |
|
Charles Rangel |
Democratic, Republican, Liberal |
107,620 |
97% |
|
Michael Liccione |
Conservative |
1,779 |
2% |
|
Barbara Taylor |
New Alliance |
1,451 |
1% |
| 1990 |
|
Charles Rangel |
Democratic, Republican, Libertarian |
55,882 |
97% |
|
Alvaader Frazier |
New Alliance |
1,592 |
3% |
|
|
|
|
|
New York's 15th congressional district: Results 1992–2010[1][2][4]
| Year |
|
Subject |
Party |
Votes |
% |
|
Opponent |
Party |
Votes |
% |
|
Opponent |
Party |
Votes |
% |
|
Opponent |
Party |
Votes |
% |
|
|---|
| 1992 |
|
Charles Rangel |
Democratic, Liberal |
105,011 |
95% |
|
Jose Suero |
Conservative |
4,345 |
4% |
|
Jessie Fields |
New Alliance |
1,337 |
1% |
|
|
|
|
|
|
| 1994 |
|
Charles Rangel |
Democratic, Liberal |
77,830 |
97% |
|
Jose Suero |
Right to Life |
2,812 |
3% |
|
|
|
|
|
|
|
|
|
|
|
| 1996 |
|
Charles Rangel |
Democratic, Liberal |
113,898 |
91% |
|
Edward Adams |
Republican |
5,951 |
5% |
|
Ruben Vargas |
Conservative, Independence |
3,896 |
3% |
|
Jose Suero |
Right to Life |
989 |
1% |
|
| 1998 |
|
Charles Rangel |
Democratic, Liberal |
90,424 |
93% |
|
David Cunningham |
Republican |
5,633 |
5% |
|
Patrick McManus |
Conservative |
1,082 |
1% |
|
|
|
|
|
|
| 2000 |
|
Charles Rangel |
Democratic, Liberal |
130,161 |
92% |
|
Jose Suero |
Republican |
7,346 |
5% |
|
Dean Loren |
Green |
2,134 |
2% |
|
Jessie Fields |
Independence |
1,051 |
1% |
[5] |
| 2002 |
|
Charles Rangel |
Democratic, Working Families |
153,099 |
91% |
|
Kenneth Jefferson |
Republican |
12,355 |
7% |
|
Jessie Fields |
Independence |
3,345 |
2% |
|
|
|
|
|
|
| 2006 |
|
Charles Rangel |
Democratic, Working Families |
103,916 |
94% |
|
Edward Daniels |
Republican |
6,592 |
6% |
|
|
|
|
|
|
|
|
|
|
|
| 2008 |
|
Charles Rangel |
Democratic, Working Families |
177,151 |
89% |
|
Edward Daniels |
Republican |
15,676 |
8% |
|
Craig Schley |
Vote People Change |
3,708 |
2% |
|
Martin Koppel |
Socialist Workers |
2,141 |
1% |
|
| 2010 |
|
Charles Rangel |
Democratic, Working Families |
91,225 |
80% |
|
Michel Faulkner |
Republican, Conservative |
11,754 |
10% |
|
Craig Schley |
Independence, Vote People Change |
7,803 |
7% |
|
Róger Calero |
Socialist Workers |
2,647 |
2% |
|
References
- 1 2 3 4 "Office of the House Clerk – Electoral Statistics". Clerk of the United States House of Representatives. pp. 1990, 1992, 1994, 1996. Retrieved March 9, 2010.
- 1 2 3 4 "Election Results". Federal Election Commission. pp. 1998, 2000, 2002, 2004, 2006, 2008. Retrieved March 9, 2010.
- ↑ Additionally, Socialist Workers candidate Paul Boutelle received 242 votes in 1978.
- ↑ http://www.elections.ny.gov/NYSBOE/elections/2010/general/2010CongressAmended01272011.pdf
- ↑ Additionally, Conservative candidate Frank Valle received 492 votes, and Libertarian candidate Scott Jeffery received 480 votes.
- ↑ "NYS Board of Elections Rep. in Congress Election Returns Nov. 6, 2012" (PDF). New York State Board of Elections. March 20, 2013. Retrieved June 11, 2013.
- ↑ "NYS Board of Elections Rep. in Congress Election Returns November 4, 2014" (PDF). New York State Board of Elections. December 15, 2014. Retrieved January 10, 2015.