Electricity sector in the United Kingdom
The electricity sector in the United Kingdom relies mainly on fossil fuelled power and 15-20% in nuclear power. The use of electricity declined 11% in 2009 compared to 2004 and respectively the renewable energy per cent share of total electricity use increased 2.8%. The annual use of electricity declined 736 kWh per person in 2009 compared to 2004. In 2008 nuclear electricity production was 860 kWh pro person. In 2014, 28.1 TW·h of energy was generated by wind power, which contributed 9.3% of the UK's electricity requirement.[2]
The United Kingdom voluntarily ended the use of incandescent lightbulbs in 2011. Between 2007 and 2012, the UK's peak electrical demand has fallen from 61.5 GW to 57.5 GW[3]
The UK is planning to reform its Electricity Market. It plans to introduce a capacity mechanism and contracts for difference to encourage the building of new generation.
Consumption
Lighting
The European Commission banned low efficiency general-purpose, non-directional incandescent lightbulbs from 2012, though similarly shaped higher-efficiency halogen bulbs continue to be available (although halogen cannot be considered high-efficiency when compared to Compact fluorescent lamp and LED bulbs). The United Kingdom banned them voluntarily from 2011 after Ireland in 2009.
Electricity per person and by power source
| Electricity per person in the United Kingdom (kWh/ hab.) [4] | ||||||||||||
|---|---|---|---|---|---|---|---|---|---|---|---|---|
| Use | Production | Import | Import % | Fossil | Nuclear | Nuc. % | Other RE* | Bio+waste | Wind | Non RE use* | RE %* | |
| 2004 | 6,741 | 6,615 | 125 | 1.9% | 4,988 | 1,337 | 19.8% | 159 | 132 | 6,450 | 4.3% | |
| 2005 | 6,791 | 6,651 | 139 | 2.0% | 4,902 | 1,355 | 20.0% | 180 | 214 | 6,397 | 5.8% | |
| 2006 | 6,624 | 6,539 | 86 | 1.3% | 5,059 | 1,026 | 15.5% | 251 | 203 | 6,171 | 6.8% | |
| 2008 | 6,573 | 6,392 | 180 | 2.8% | 5,069 | 860 | 13.1% | 266 | 198 | 6,108 | 7.1% | |
| 2009 | 6,005 | 5,958 | 47 | 0.8% | 4,411 | 1,120 | 18.7% | 84* | 204 | 138* | 5,579 | 7.1% |
| * Other RE is waterpower, solar and geothermal electricity and windpower until 2008 * Non RE use = use – production of renewable electricity * RE % = (production of RE / use) * 100% Note: EU calculates the share of renewable energies in gross electrical consumption. | ||||||||||||
Mode of production
|
|
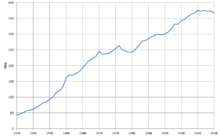
The gross production of electricity was 393 TWh in 2004 which gave the 9th position in the world top producers in 2004.[8]
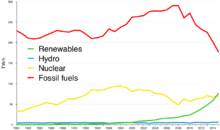
The mode of production has changed over the years. During the 1960s and 70s, coal plants were built to supply consumption despite economic challenges. During the 1970s and 80s some nuclear sites were built. From the 1990s gas power plants benefited from the Dash for Gas supplied by North Sea gas. After the 2000s, renewables like solar and wind added signigicant capacity.[9]
The 6 major companies which dominate the British electricity market ("The Big Six") are: EDF, Centrica (British Gas), E.ON, RWE npower, Scottish Power and Southern & Scottish Energy.
Gas and coal
Electricity was produced with gas 160 TWh in 2004 and 177 TWh in 2008. The United Kingdom was 4th top electricity producer from gas both in 2004 and in 2008. In 2005 the UK produced 3.2% of the world total natural gas having the 5th top position after Russia (21.8%), United States (18%), Canada (6.5%) and Algeria (3.2%). In 2009 the UK’s own gas production was less and natural gas was also imported.[8][10]
Due to reducing demand in the late-2000s recession and high gas prices, in 2011 and 2012 over 2 GW of older, less efficient, gas generation plant was mothballed.[11][12]
On several occasions in May 2016, Britain burned no coal for electricity for the first time since 1882.[13][14] Due to lower gas prices, economy of coal plants is strained, and 3 coal plants closed in 2016.[15]
Nuclear power
The installed nuclear power capacity in the United Kingdom was 11 GW in 2008.[10] The production of nuclear power was 80 TWh in 2004 (2.9% of world total) [8] and 63 TWh in 2007 (2.3% of world total) [16] The production of nuclear electricity was lower in 2006 and 2008 than the actual capacity. The electricity consumption declined in 2009 compared to 2004 by 736 kWh/person when the nuclear energy was produced at nearly same volume 860 kWh/person in 2008. Further, Denmark produced more wind power per person (1,218 kWh/person) than the nuclear power produced annually per person in the United Kingdom between 2006 and 2009 (860-1,120 kWh/person).[4]
Renewable energy
From the mid-1990s renewable energy began to contribute to the electricity generated in the United Kingdom, adding to a small hydroelectricity generating capacity. Renewable energy sources provided for 11.3% of the electricity generated in the United Kingdom in 2012,[17] reaching 41.3 TWh of electricity generated.
According to Imperial College Britain could have 40% of electricity from solar power in sunny days by 2020 in 10 million homes compared to a half a million homes in start of 2014. If a third of households would generate solar energy it could equal 6% of British total electricity consumption.[18]
Power stations
|
| |
|
|
National Grid
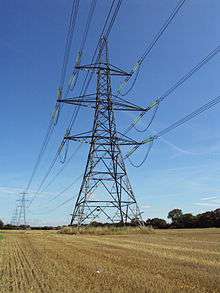
The National Grid is the high-voltage electric power transmission network in Great Britain, connecting power stations and major substations and ensuring that electricity generated anywhere in England, Scotland and Wales can be used to satisfy demand elsewhere. There are also undersea interconnections to northern France (HVDC Cross-Channel), Northern Ireland (HVDC Moyle), the Isle of Man (Isle of Man to England Interconnector), the Netherlands (BritNed) and the Republic of Ireland (EirGrid).
On the breakup of the Central Electricity Generating Board in 1990, the ownership and operation of the National Grid in England and Wales passed to National Grid Company plc, later to become National Grid Transco, and now National Grid plc. In Scotland the grid split into two separate entities, one for southern and central Scotland and the other for northern Scotland, connected by interconnectors to each other. The first is owned and maintained by SP Energy Networks, a subsidiary of Scottish Power, and the other by SSE. However, National Grid plc remains the System Operator for the whole UK Grid.
Export/import
The export of electricity was 1-3% of consumption between 2004-2009. According to IEA the UK was the 6th highest electricity importer, importing 11 TWh, after Brazil (42TWh), Italy (40TWh), United States (33TWh), Netherlands (16TWh) and Finland (14TWh).[10]
The UK grid is connected to adjacent European and Irish electrical grids by submarine power cables, including for links to northern France (HVDC Cross-Channel), Northern Ireland (HVDC Moyle), Republic of Ireland (East–West Interconnector), the Isle of Man (Isle of Man to England Interconnector), and the Netherlands (BritNed). There are also plans to lay cables to link the UK with Iceland and Norway (Scotland–Norway interconnector) in the future.
Electricity billing
In the UK, an electricity supplier is a retailer of electricity. For each supply point the supplier has to pay the various costs of transmission, distribution, meter operation, data collection, tax etc. The supplier then adds in energy costs and the supplier's own charge.
See also
- Energy in the United Kingdom
- Energy policy of the United Kingdom
- National Grid (Great Britain)
- Decarbonisation measures in proposed UK electricity market reform
References
- ↑ "Digest of UK energy statistics: 60th Anniversary Report". Retrieved 16 December 2013.
- ↑ RenewableUK News website article
- ↑ "Peak Light Bulb". New Scientist. 4 January 2014. p. 4.
- 1 2 Energy in Sweden, Facts and figures, The Swedish Energy Agency, (in Swedish: Energiläget i siffror), Table: Specific electricity production per inhabitant with breakdown by power source (kWh/person), Source: IEA/OECD 2006 T23, 2007 T25, 2008 T26, 2009 T25 and 2010 T49.
- ↑
- ↑ https://www.gov.uk/government/uploads/system/uploads/attachment_data/file/513244/Press_Notice_March_2016.pdf
- ↑ https://www.gov.uk/government/uploads/system/uploads/attachment_data/file/296183/pn_march_14.pdf
- 1 2 3 IEA Key energy statistics 2006
- ↑ "Mapped: How the UK generates its electricity - Carbon Brief". Carbon Brief. 12 October 2015. Retrieved 6 October 2016.
- 1 2 3 IEA Key energy statistics 2010 pages electricity 27 gas 13,25 fossil 25 nuclear 17
- ↑ Andreas Walstad (2 August 2011). "UK power plants mothballed on higher gas prices". National Gas Daily. Interfax. Retrieved 9 April 2012.
- ↑ "Centrica idles gas-fired plant amid low spark spreads". Argus Media. 12 March 2012. Retrieved 9 April 2012.
- ↑ "Britain passes historic milestone with first days of coal-free power". Financial Times. Retrieved 19 June 2016.
- ↑ "Britain gets no power from coal for 'first time on record'". The Telegraph. 10 May 2016. Retrieved 19 June 2016.
- ↑ Countdown to 2025: Tracking the UK coal phase out 21 July 2016.
- ↑ pdf IEA Key energy statistics 2009
- ↑ "Department of Energy and Climate Change: Annual tables: 'Digest of UK energy statistics' (DUKES) - Chapter 6: Renewable Sources of energy". Retrieved 1 September 2013.
- ↑ UK should have 10 million homes with solar panels by 2020, experts say, Imperial College says Britain could get as much as 40% of its electricity from solar power on sunny days by decade's end 29 January 2014