Foyle (UK Parliament constituency)
Coordinates: 55°01′34″N 7°23′46″W / 55.026°N 7.396°W
| Foyle | |
|---|---|
|
County constituency for the House of Commons | |
|
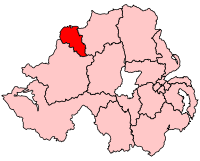
Boundary of Foyle in Northern Ireland 1995 – 2008. | |
| Districts of Northern Ireland | Derry City Council |
| Electorate | 68,565 (March 2011) |
| Current constituency | |
| Created | 1983 |
| Member of parliament | Mark Durkan (SDLP) |
| Number of members | One |
| Created from | Londonderry and Mid Ulster[1] |
| Overlaps | |
| European Parliament constituency | Northern Ireland |
Foyle is a parliamentary constituency in the House of Commons of the United Kingdom. It has been represented since 2005 by Mark Durkan, of the Social Democratic and Labour Party.
Boundaries
1983-1997: The District of Londonderry, and the District of Strabane wards of Artigarvan, Dunnamanagh, East, North, Slievekirk, South, and West.
1997-2010: The District of Derry.
2010-present: The District of Derry wards of Altnagelvin, Ballynashallog, Beechwood, Brandywell, Carn Hill, Caw, Clondermot, Creggan Central, Creggan South, Crevagh, Culmore, Ebrington, Eglinton, Enagh, Foyle Springs, Holly Mount, Kilfennan, Lisnagelvin, New Buildings, Pennyburn, Rosemount, Shantallow East, Shantallow West, Springtown, Strand, The Diamond, Victoria, and Westland.
The seat was created in boundary changes in 1983, as part of an expansion of Northern Ireland's constituencies from 12 to 17, and was predominantly made up from the old Londonderry constituency. From further revisions in 1995 (when it lost parts of the district of Strabane to the West Tyrone constituency), and until the 2008 revision, it covered exactly the same area as Derry city.

The name comes from the River Foyle which the city lies on and is used to avoid the contentious names of Derry or Londonderry, as well as to cover the areas of County Tyrone that were originally in the constituency.
Prior to the 2010 general election the transfer of Claudy and Banagher wards to East Londonderry were approved through the passing of the Northern Ireland Parliamentary Constituencies Order[2] in 2008.
History
For the history of the equivalent constituency prior to 1983, see Londonderry.
The constituency is overwhelmingly nationalist and in many elections has often had the strongest vote for the Social Democratic and Labour Party (SDLP) in the whole of Northern Ireland.
There had been much speculation that with the gradual retirement of John Hume from politics, the SDLP vote might collapse. In the 2003 Northern Ireland Assembly election, the SDLP lost 11.5% of the vote and were only narrowly ahead of Sinn Féin. Hume's retirement led to many questioning whether Mark Durkan, Hume's successor as leader, could hold on to the seat. However in the 2005 general election he did so. The decline in the Unionist vote suggests that some Unionist voters tactically voted for Durkan.
Durkan retained the seat in 2010. This seat also gave the Alliance Party their worst share of the vote in Northern Ireland, polling just 0.6% of the votes.
Durkan was re-elected to a third term in 2015, increasing his share of the vote to 47.9% and winning a majority of 6046 votes.
Members of Parliament
The Member of Parliament since the 2005 general election is Mark Durkan of the Social Democratic and Labour Party. He succeeded John Hume, also of the SDLP, who had represented the seat since its creation for the 1983 general election.
| Election | Member | Party | |
|---|---|---|---|
| 1983 | John Hume | SDLP | |
| 2005 | Mark Durkan | SDLP | |
Elections
Elections in the 2010s
| Party | Candidate | Votes | % | ± | |
|---|---|---|---|---|---|
| SDLP | Mark Durkan | 17,725 | 47.9 | +3.2 | |
| Sinn Féin | Gearóid Ó hEára | 11,679 | 31.6 | −0.4 | |
| DUP | Gary Middleton | 4,573 | 12.4 | +0.5 | |
| UUP | Julia Kee | 1,226 | 3.3 | +0.1 | |
| Alliance | David Hawthorne | 835 | 2.3 | +1.7 | |
| UKIP | Kyle Thompson | 832 | 2.2 | N/A | |
| NI Conservatives | Hamish Badenoch | 132 | 0.4 | N/A | |
| Majority | 6,046 | 16.3 | +3.6 | ||
| Turnout | 37,002 | 52.8 | −4.7 | ||
| SDLP hold | Swing | +1.8 | |||
| Party | Candidate | Votes | % | ± | |
|---|---|---|---|---|---|
| SDLP | Mark Durkan[6] | 16,922 | 44.7 | −1.7 | |
| Sinn Féin | Martina Anderson[7] | 12,098 | 31.9 | −1.4 | |
| DUP | Maurice Devenney[8] | 4,489 | 11.8 | −2.2 | |
| People Before Profit | Eamonn McCann[9] | 2,936 | 7.7 | N/A | |
| UCU-NF | David Harding[10] | 1,221 | 3.2 | +0.9 | |
| Alliance | Keith McGrellis[11] | 223 | 0.6 | +0.6 | |
| Majority | 4,824 | 12.7 | −0.4 | ||
| Turnout | 37,889 | 57.5 | −12.5 | ||
| SDLP hold | Swing | −0.2 | |||
Elections in the 2000s
| Party | Candidate | Votes | % | ± | |
|---|---|---|---|---|---|
| SDLP | Mark Durkan | 21,119 | 46.3 | −3.9 | |
| Sinn Féin | Mitchel McLaughlin | 15,162 | 33.2 | +6.6 | |
| DUP | William Hay | 6,557 | 14.4 | −0.8 | |
| Socialist Environmental | Eamonn McCann | 1,649 | 3.6 | +3.6 | |
| UUP | Earl Storey | 1,091 | 2.4 | −4.5 | |
| Rainbow Dream Ticket | Ben Reel | 31 | 0.1 | +0.1 | |
| Majority | 5,957 | 13.1 | −10.5 | ||
| Turnout | 45,609 | 65.9 | −3.0 | ||
| SDLP hold | Swing | −5.3 | |||
| Party | Candidate | Votes | % | ± | |
|---|---|---|---|---|---|
| SDLP | John Hume | 24,538 | 50.2 | −2.3 | |
| Sinn Féin | Mitchel McLaughlin | 12,988 | 26.6 | +2.6 | |
| DUP | William Hay | 7,414 | 15.2 | −6.4 | |
| UUP | Andrew Davidson | 3,360 | 6.9 | N/A | |
| Alliance | Colm Kavanagh | 579 | 1.2 | −0.5 | |
| Majority | 11,550 | 23.6 | |||
| Turnout | 48,879 | 68.9 | −1.8 | ||
| SDLP hold | Swing | −2.5 | |||
Elections in the 1990s
| Party | Candidate | Votes | % | ± | |
|---|---|---|---|---|---|
| SDLP | John Hume | 25,109 | 52.5 | +1.0 | |
| Sinn Féin | Mitchel McLaughlin | 11,445 | 23.9 | +6.3 | |
| DUP | William Hay | 10,290 | 21.5 | −4.9 | |
| Alliance | Helen-Marie Bell | 817 | 1.7 | −1.0 | |
| Natural Law | Donn Brennan | 154 | 0.3 | −0.5 | |
| Majority | 13,664 | 28.6 | |||
| Turnout | 47,815 | 70.4 | |||
| SDLP hold | Swing | −3.7 | |||
| Party | Candidate | Votes | % | ± | |
|---|---|---|---|---|---|
| SDLP | John Hume | 26,710 | 51.5 | +2.7 | |
| DUP | Gregory Lloyd Campbell | 13,705 | 26.4 | −2.2 | |
| Sinn Féin | Martin McGuinness | 9,149 | 17.6 | −0.3 | |
| Alliance | Lara Alexandra McIlroy | 1,390 | 2.7 | +0.1 | |
| Workers' Party | Gordon McKenzie | 514 | 1.0 | −1.1 | |
| Natural Law | John Joseph Pius Burns | 422 | 0.8 | N/A | |
| Majority | 13,005 | 25.1 | |||
| Turnout | 51,890 | 69.5 | |||
| SDLP hold | Swing | +2.5 | |||
Elections in the 1980s
| Party | Candidate | Votes | % | ± | |
|---|---|---|---|---|---|
| SDLP | John Hume | 23,743 | 48.8 | +2.8 | |
| DUP | Gregory Lloyd Campbell | 13,883 | 28.6 | −1.9 | |
| Sinn Féin | Martin McGuinness | 8,707 | 17.9 | −2.4 | |
| Alliance | Elizabeth Ann Zammitt | 1,276 | 2.6 | +0.5 | |
| Workers' Party | Eamonn Melaugh | 1,022 | 2.1 | +1.0 | |
| Majority | 9,860 | 20.3 | |||
| Turnout | 48,631 | 69.0 | |||
| SDLP hold | Swing | +2.4 | |||
| Party | Candidate | Votes | % | ± | |
|---|---|---|---|---|---|
| SDLP | John Hume | 24,071 | 46.0 | N/A | |
| DUP | Gregory Lloyd Campbell | 15,923 | 30.5 | N/A | |
| Sinn Féin | Martin McGuinness | 10,607 | 20.3 | N/A | |
| Alliance | Gerard O'Grady | 1,108 | 2.1 | N/A | |
| Workers' Party | Eamonn Melaugh | 582 | 1.1 | N/A | |
| Majority | 8,148 | 15.6 | N/A | ||
| Turnout | 52,291 | 77.6 | N/A | ||
| SDLP win (new seat) | |||||
See also
- Foyle and City of Londonderry were neighbouring constituencies in the Northern Ireland Parliament from 1929 to 1973.
- Londonderry City was a borough constituency in the UK parliament from the Act of Union to 1922.
References
- ↑ "'Foyle', June 1983 up to May 1997". ElectionWeb Project. Cognitive Computing Limited. Retrieved 11 March 2016.
- ↑ http://www.opsi.gov.uk/si/si2008/draft/ukdsi_9780110813172_en_1
- ↑ "Election Data 2015". Electoral Calculus. Archived from the original on 17 October 2015. Retrieved 17 October 2015.
- ↑ http://www.eoni.org.uk/Elections/Election-results-and-statistics/Election-results-and-statistics-2003-onwards/Elections-2015/UK-Parliamentary-Election-Results/UK-Parliamentary-Election-Result-Belfast-East-(7) 23Aug15
- ↑ "Election Data 2010". Electoral Calculus. Archived from the original on 26 July 2013. Retrieved 17 October 2015.
- ↑ "Durkan selected as Foyle Westminster candidate", SDLP
- ↑ Foyle, UKPollingReport
- ↑ Harding named UUP candidate in forthcoming election, Londonderry Sentinel, 1 April 2010
- ↑ Vote People Before Profit Alliance in May's Westminster Election, People Before Profit Alliance, 24 March 2010
- ↑ Westminster Candidates, Ulster Unionist Party, 20 March 2010
- ↑ Alliance List of Candidates, Alliance Party of Northern Ireland, 6 May 2010
- ↑ "Election Data 2005". Electoral Calculus. Archived from the original on 15 October 2011. Retrieved 18 October 2015.
- ↑ "Election Data 2001". Electoral Calculus. Archived from the original on 15 October 2011. Retrieved 18 October 2015.
- ↑ "Election Data 1997". Electoral Calculus. Archived from the original on 15 October 2011. Retrieved 18 October 2015.
- ↑ "Election Data 1992". Electoral Calculus. Archived from the original on 15 October 2011. Retrieved 18 October 2015.
- ↑ "Election Data 1987". Electoral Calculus. Archived from the original on 15 October 2011. Retrieved 18 October 2015.
- ↑ "Election Data 1983". Electoral Calculus. Archived from the original on 15 October 2011. Retrieved 18 October 2015.