LGBT demographics of the United States
The demographics of sexual orientation and gender identity in the United States have been more accurately studied in the social sciences in recent decades. In the first large-scale government survey measuring Americans’ sexual orientation, the NHIS reported in July 2014 that 1.6 percent of Americans identify as gay or lesbian, and 0.7 percent identify as bisexual.[1] In a Williams Institute review based on an June–September 2012 Gallup poll, approximately 3.4 percent of American adults identify themselves as being LGBT (lesbian, gay, bisexual, or transgender).[2] An earlier report published in April 2011 by the Williams Institute estimated that 3.8 percent of Americans identified as gay/lesbian, bisexual, or transgender: 1.7 percent as lesbian or gay, 1.8 percent as bisexual, and 0.3 percent as transgender.[3] The 2011 Williams Institute report also states that 8.2 percent of Americans reported that they had engaged in same-sex sexual behavior, and 11 percent reported some same-sex attraction. Studies from several nations, including the U.S., conducted at varying time periods, have produced a statistical range of 1.2[3] to 6.8[4] percent of the adult population identifying as LGBT. Online surveys tend to yield higher figures than other methods,[4] a likely result of the higher degree of anonymity of Internet surveys, which elicit reduced levels of socially desirable responding.[5]
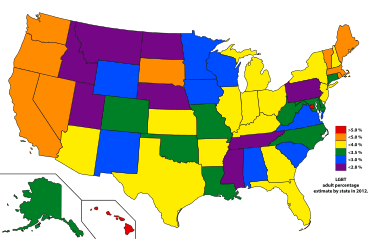
State-by-state summary
| Pop. Rank |
% Rank |
State or Territory | 2012 LGBT Adult Percentage Estimate[6] |
2012 State Total Population Estimate[7] |
2012 LGBT Adult Population Estimate |
2000 Same-Sex Couple Households[8] |
2010 Same-Sex Couple Households[9] |
2000 to 2010 Couple Households Growth[10] |
LGB
Employment Discrimination |
Transgender
Employment Discrimination |
|---|---|---|---|---|---|---|---|---|---|---|
| 1 | 10 | 4.0% | 38,041,430 | 1,338,164 | 92,138 | 98,153 | 6.53% | Protections for all employment | Protections for all employment | |
| 2 | 32 | 3.6% | 26,059,203 | 579,968 | 42,912 | 46,401 | 8.13% | No state-level protections | No state-level protections | |
| 3 | 14 | 3.8% | 19,570,261 | 570,388 | 46,490 | 48,932 | 4.05% | Protections for all employment | Protections only in public employment | |
| 4 | 23 | 3.5% | 19,317,568 | 513,847 | 41,048 | 48,496 | 18.15% | No state-level protections | No state-level protections | |
| 5 | 16 | 3.8% | 12,875,255 | 362,048 | 22,887 | 23,049 | 0.07% | Protections for all employment | Protections for all employment | |
| 6 | 21 | 3.6% | 11,544,225 | 315,592 | 18,937 | 19,684 | 3.95% | Protections only in public employment | No state-level protections | |
| 7 | 15 | 3.8% | 9,883,360 | 285,431 | 15,368 | 14,598 | -5.0% | Protections only in public employment | Protections only in public employment | |
| 8 | 22 | 3.5% | 9,919,945 | 263,870 | 19,288 | 21,318 | 10.52% | No state-level protections | No state-level protections | |
| 9 | 44 | 2.7% | 12,763,536 | 262,308 | 21,166 | 22,336 | 5.50% | Protections only in public employment | Protections only in public employment | |
| 10 | 18 | 3.7% | 8,864,590 | 249,273 | 16,604 | 16,875 | 1.60% | Protections for all employment | Protections for all employment | |
| 11 | 31 | 3.3% | 9,752,073 | 244,582 | 16,198 | 18,309 | 11.36% | No state-level protections | No state-level protections | |
| 12 | 7 | 4.4% | 6,646,144 | 247,247 | 17,099 | 20,256 | 18.46% | Protections for all employment | Protections for all employment | |
| 13 | 11 | 4.0% | 6,897,012 | 209,670 | 15,900 | 19,003 | 19.51% | Protections for all employment | Protections for all employment | |
| 14 | 13 | 3.9% | 6,553,255 | 194,238 | 12,332 | 15,817 | 28.25% | Protections only in public employment | No state-level protections | |
| 15 | 19 | 3.7% | 6,537,334 | 183,829 | 10,219 | 11,074 | 8.37% | Protections only in public employment | Protections only in public employment | |
| 16 | 37 | 2.9% | 8,185,867 | 180,416 | 13,802 | 14,243 | 3.20% | Protections only in public employment | Protections only in public employment | |
| 17 | 30 | 3.3% | 6,021,988 | 151,032 | 9,428 | 10,557 | 10.70% | Protections only in public employment | No state-level protections | |
| 18 | 29 | 3.3% | 5,884,563 | 147,584 | 11,243 | 12,538 | 11.52% | Protections for all employment | Protections for all employment | |
| 19 | 4 | 4.9% | 3,899,353 | 145,212 | 8,932 | 11,773 | 31.80% | Protections for all employment | Protections for all employment | |
| 20 | 12 | 3.9% | 4,380,415 | 129,836 | 7,114 | 7,195 | 1.13% | Protections only in public employment | Protections only in public employment | |
| 21 | 48 | 2.6% | 6,456,243 | 127,526 | 10,189 | 10,898 | 6.95% | No state-level protections | No state-level protections | |
| 22 | 34 | 3.2% | 5,187,582 | 126,162 | 10,045 | 12,424 | 23.70% | Protections for all employment | Protections for all employment | |
| 23 | 41 | 2.8% | 5,726,398 | 121,858 | 8,232 | 9,179 | 10.32% | Protections for all employment | No state-level protections | |
| 24 | 36 | 2.9% | 5,379,139 | 118,556 | 9,147 | 10,207 | 11.60% | Protections for all employment | Protections for all employment | |
| 25 | 33 | 3.2% | 4,601,893 | 111,918 | 8,808 | 8,076 | -8.31% | No state-level protections | No state-level protections | |
| 26 | 38 | 2.9% | 4,723,723 | 104,111 | 7,609 | 7,214 | 5.20% | No state-level protections | No state-level protections | |
| 27 | 43 | 2.8% | 4,822,023 | 102,613 | 8,109 | 6,582 | -18.80% | No state-level protections | No state-level protections | |
| 28 | 27 | 3.4% | 3,814,820 | 98,575 | 5,763 | 6,134 | 6.44% | No state-level protections | No state-level protections | |
| 29 | 9 | 4.2% | 2,758,931 | 88,065 | 4,973 | 7,140 | 43.60% | Protections for all employment | Protections for all employment | |
| 30 | 20 | 3.7% | 2,885,905 | 81,152 | 3,973 | 4,009 | 0.09% | No state-level protections | No state-level protections | |
| 31 | 24 | 3.5% | 2,949,131 | 78,441 | 4,423 | 4,226 | -4.45% | No state-level protections | No state-level protections | |
| 32 | 25 | 3.4% | 3,590,347 | 92,775 | 7,386 | 7,852 | 6.30% | Protections for all employment | Protections for all employment | |
| 33 | 42 | 2.8% | 3,074,186 | 65,419 | 3,698 | 4,093 | 10.70% | Protections for all employment | Protections for all employment | |
| 34 | 49 | 2.6% | 2,984,926 | 58,982 | 4,774 | 3,484 | -27.00% | No state-level protections | No state-level protections | |
| 35 | 47 | 2.7% | 2,855,287 | 58,591 | 3,360 | 5,814 | 73.03% | Protections for all employment | Protections for all employment | |
| 36 | 2 | 5.1% | 1,392,313 | 53,966 | 2,389 | 3,239 | 35.45% | Protections for all employment | Protections for all employment | |
| 37 | 5 | 4.8% | 1,329,192 | 48,489 | 3,394 | 3,958 | 16.61% | Protections for all employment | Protections for all employment | |
| 38 | 1 | 7.6% | 632,323 | 48,057 | 3,678 | 4,822 | 31.10% | Protections for all employment | Protections for all employment | |
| 39 | 40 | 2.9% | 2,085,538 | 45,965 | 4,496 | 5,825 | 25.56% | Protections for all employment | Protections for all employment | |
| 40 | 35 | 3.1% | 1,855,413 | 43,713 | 2,916 | 2,848 | -2.33% | No state-level protections | No state-level protections | |
| 41 | 45 | 2.7% | 1,855,525 | 38,075 | 2,332 | 2,356 | 0.01% | No state-level protections | No state-level protections | |
| 42 | 17 | 3.7% | 1,320,718 | 31,138 | 2,703 | 3,260 | 20.60% | Protections for all employment | No state-level protections | |
| 43 | 6 | 4.5% | 1,050,292 | 35,920 | 2,471 | 2,785 | 12.71% | Protections for all employment | Protections for all employment | |
| 44 | 46 | 2.7% | 1,595,728 | 32,744 | 1,873 | 2,042 | 9.02% | No state-level protections | No state-level protections | |
| 45 | 8 | 4.4% | 833,354 | 27,867 | 826 | 714 | -13.36% | No state-level protections | No state-level protections | |
| 46 | 26 | 3.4% | 917,092 | 23,698 | 1,868 | 2,646 | 41.65% | Protections for all employment | Protections for all employment | |
| 47 | 3 | 4.9% | 626,011 | 23,313 | 1,933 | 2,143 | 10.61% | Protections for all employment | Protections for all employment | |
| 48 | 50 | 2.6% | 1,005,141 | 19,862 | 1,218 | 1,848 | 10.70% | Protections only in public employment | No state-level protections | |
| 49 | 28 | 3.4% | 731,449 | 24,869 | 1,180 | 1,228 | 4.06% | Protections only in public employment | No state-level protections | |
| 50 | 39 | 2.9% | 576,412 | 16,716 | 807 | 657 | -18.60% | No state-level protections | No state-level protections | |
| 51 | 51 | 1.7% | 699,628 | 9,040 | 703 | 559 | -20.50 | No state-level protections | No state-level protections | |
| — | — | Total | 3.8% | Total Population 313,914,039: Adult Population 238,574,670:[11] | 9,083,558 [12] | 594,391 | 646,464 | 8.76% |
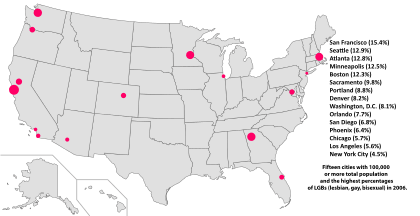
By locality
The American cities with the highest gay populations are New York City with 272,493, Los Angeles with 154,270, Chicago with 114,449, and San Francisco with 94,234, as estimated by the Williams Institute in 2006.[13] However, one is much more likely to encounter gay residents in San Francisco, Seattle, Atlanta, Minneapolis, and Boston as a higher percentage of those cities' residents are gay or lesbian.
The U.S. metropolitan areas with the most gay residents are the New York, New York–Northern New Jersey–Long Island, New York metro with 568,903; followed by Los Angeles–Long Beach–Santa Ana, California with 442,211; and the Chicago-Naperville-Joliet, Illinois-Indiana-Wisconsin metro with 288,748.[14]
The charts below show a list of the top U.S. cities (in alphabetical order), metropolitan areas, and states with the highest population of gay residents and the highest percentage of gay residents (GLB population as a percentage of total residents based on available census data).[13] The numbers given are estimates based on American Community Survey data for the year 2000.[15]
By city
| % Rank |
City | 2005 LGB Percentage Estimate[16] |
2005 LGB Population Estimate[16] |
|---|---|---|---|
| 1 | 15.4% | 94,234 | |
| 2 | Seattle | 12.9% | 57,993 |
| 3 | 12.8% | 39,805 | |
| 4 | 12.5% | 34,295 | |
| 5 | 12.3% | 50,450 | |
| 6 | 9.8% | 32,108 | |
| 7 | 8.8% | 35,413 | |
| 8 | 8.2% | 33,698 | |
| 9 | 8.1% | 32,599 | |
| 10 | 7.7% | 12,508 | |
| 11 | Salt Lake City | 7.6% | 10,726 |
| 12 | 7.0% | 58,473 | |
| 13 | 6.9% | 30,778 | |
| 14 | Hartford | 6.8% | 5,292 |
| 15 | 6.8% | 9,371 | |
| 16 | 6.8% | 61,945 | |
| 17 | 6.8% | 16,868 | |
| 18 | 6.7% | 34,952 | |
| 19 | 6.7% | 22,360 | |
| 20 | Phoenix | 6.4% | 63,222 |
| 21 | 6.1% | 14,119 | |
| 22 | 5.8% | 37,260 | |
| 23 | 5.7% | 114,449 | |
| 24 | 5.6% | 9,263 | |
| 25 | 5.6% | 154,270 | |
| 26 | 5.5% | 15,227 | |
| 27 | Nashville-Davidson | 5.1% | 20,313 |
| 28 | 5.1% | 16,554 | |
| 29 | Austin | 4.8% | 24,615 |
| 30 | 4.8% | 26,712 | |
| 31 | Providence | 4.8% | 5,564 |
| 32 | 4.6% | 17,925 | |
| 33 | 4.6% | 18,243 | |
| 34 | 4.5% | 272,493 | |
| 35 | 4.4% | 61,976 | |
By metropolitan area
Statistics by year
1990s
- 1990
"Homosexuality/Heterosexuality: Concepts of Sexual Orientation" published findings of 13.95% of males and 4.25% of females having had either "extensive" or "more than incidental" homosexual experience.[18]
- 1990
An extensive study on sexuality in general was conducted in the United States. A significant portion of the study was geared towards homosexuality. The results found that 8.6% of women and 10.1% of men had at one point in their life experienced some form of homosexuality. Of these, 87% of women and 76% of men reported current same-sex attractions, 41% of women and 52% of men had sex with someone of the same gender, and 16% of women and 27% of men identified as LGBT.[19]
- 1990–92
The American National Health Interview Survey conducts household interviews of the civilian non-institutionalized population. The results of three of these surveys, done in 1990–91 and based on over 9,000 responses each time, found between 2–3% of the people responding said yes to a set of statements which included "You are a man who has had sex with another man at some time since 1977, even one time."[20]
- 1992
The National Health and Social Life Survey asked 3,432 respondents whether they had any homosexual experience. The findings were 1.3% for women within the past year, and 4.1% since 18 years; for men, 2.7% within the past year, and 4.9% since 18 years.[21]
- 1993
The Alan Guttmacher Institute of sexually active men aged 20–39 found that 2.3% had experienced same-sex sexual activity in the last ten years, and 1.1% reported exclusive homosexual contact during that time.[22]
- 1993
Researchers Samuel and Cynthia Janus surveyed American adults aged 18 and over by distributing 4,550 questionnaires; 3,260 were returned and 2,765 were usable. The results of the cross-sectional nationwide survey stated men and women who reported frequent or ongoing homosexual experiences were 9% of men and 5% of women.[23]
- 1994
Laumann et al. analyzed the National Health and Social Life Survey of 1992 which had surveyed 3,432 men and women in the United States between the ages of 18 and 59 and reported that the incidence rate of homosexual desire was 7.7% for men and 7.5% for women.[24]
- 1998
A random survey of 1672 males (number used for analysis) aged 15 to 19. Subjects were asked a number of questions, including questions relating to same-sex activity. This was done using two methods—a pencil and paper method, and via computer, supplemented by a verbal rendition of the questionnaire heard through headphones—which obtained vastly different results. There was a 400% increase in males reporting homosexual activity when the computer-audio system was used: from a 1.5% to 5.5% positive response rate; the homosexual behavior with the greatest reporting difference (800%, adjusted) was to the question "Ever had receptive anal sex with another male": 0.1% to 0.8%.[25]
2000s
- 2000
During the 2000 US presidential election campaign, market research firm Harris Interactive studied the prevalence of a gay, lesbian, bisexual or transgender identity employing three distinct methods. In phone interviews, 2% of the population self-identified as LGBT. Using in-person surveys with a blind envelope, that grew to 4%, and using online polls 6%. The group concluded that the difference between methods was due to the greater level of anonymity and privacy to online surveys, which provides more comfort to respondents to share their experiences.[26]
- 2003
Smith's 2003 analysis of National Opinion Research Center data[27] states that 4.9% of sexually active American males have had a male sexual partner since age 18, but that "since age 18 less than 1% are [exclusively] gay and 4+% bisexual". In the top twelve urban areas however, the rates are double the national average. Smith adds, "It is generally believed that including adolescent behavior would further increase these rates." The NORC data has been criticised because the original design sampling techniques were not followed, and depended upon direct self-report regarding masturbation and same sex behaviors. (For example, the original data in the early 1990s reported that approximately 40% of adult males had never masturbated—a finding inconsistent with some other studies.)
- 2003
In a telephone survey of 4,193 male residents of New York City, 91.3% of men identified as straight, 3.7% as gay, and 1.2% as bisexual. 1.7% said they were in doubt or were not sure and 2.1% declined to answer. 12.4% of men who responded to the sexual orientation question, reported sex exclusively with men in the 12 months prior to the survey. Most of them (~70%) identified as heterosexual.[28]
- 2005
The American Community Survey from the U.S. Census estimated 776,943 same-sex couples in the country as a whole, representing about 0.5% of the population.[13]
- 2006
Fried's 2008 analysis of General Social Survey data shows the percentage of United States males reporting homosexual activity for three time periods: 1988–92, 1993–98, and 2000–06. These results are broken out by political party self-identification, and indicate increasing percentages, particularly among Democrats (perhaps reflecting, in the authors' view, either a shift of political allegiance among gay Americans, or increasing likelihood of acknowledging a homosexual orientation).[29]
- 2007
Cornell University, carrying out research into sexuality amongst a representative sample of more than 20,000 young Americans, published that 14.4% of young women were not strictly heterosexual in behavior, a group that included lesbian and bisexual women; 5.6% of young men self-identified as being gay or bisexual.[30]
- 2008
CNN exit polling showed self-identified gay, lesbian, and bisexual voters at 4% of the voting population in the United States presidential election, 2008.[31]
2010s
- 2003-2010
The National Health and Nutrition Examination Surveys interviewed a nationally representative sample of 11,744 adults aged 20 to 59 between 2003 and 2010. One hundred and eighty (1.5%) self-reported a homosexual orientation and 273 (2.3%) a bisexual one.[32]
- 2010
The National Survey of Sexual Health and Behavior surveyed nearly 6,000 people nationwide between the ages of 14 and 94 through an online methodology and found that 7 percent of women and 8 percent of men identify as gay, lesbian or bisexual.[33]
- 2010
Using a phone methodology, the National Intimate Partner and Sexual Violence Survey found, in a sample of about 10,000 women and 8,000 men, that 1.3% of women and 2% of men identify as gay or lesbian, and 1.2% of men and 2.2% of women identify as bisexual.[34]
- 2012
A Gallup report published in October 2012 by the Williams Institute reported that 3.4% of US adults identify as lesbian, gay, bisexual or transgender. Minorities were more likely to identify as non-heterosexual; 4.6% of blacks, 4.0% of Hispanics and 3.2% of whites. Younger people, aged 18–29, were three times more likely to identify as LGBT than seniors over the age of 65, the numbers being 6.4% and 1.9%, respectively.[3][35]
- 2012
The National Election Pool found that, among voters on Election Day, 5% identify as gay, lesbian, or bisexual.[36][37]
- 2013
In the first large-scale government survey measuring Americans’ sexual orientation, the NHIS reported in July 2014 that 1.6 percent of Americans identify as gay or lesbian, and 0.7 percent identify as bisexual.[1] 1.5 percent of women self-identify as lesbian and 0.9 consider themselves bisexual, while 1.8 percent of men consider themselves gay and 0.4 percent identify as bisexual.[1]
- 2002-2013 National Survey of Family Growth
The National Survey of Family Growth is a nationally representative, multi-year survey of teenagers and adults aged 15-44. The sexual orientation items are presented only to interviewees over age 18. Results are presented separately for women and men.
- Women:
| Gay/lesbian | Bisexual | Something else | Heterosexual | Did not report | |
|---|---|---|---|---|---|
| 2002[38] | 1.3% | 2.8% | 3.8% | 90.3% | 1.8% |
| 2006-2010[39] | 1.2% | 3.9% | 0.4% | 93.6% | 0.8% |
| 2011-2013[40] | 1.3% | 5.5% | — | 92.3% | 0.9% |
- Men:
| Gay/lesbian | Bisexual | Something else | Heterosexual | Did not report | |
|---|---|---|---|---|---|
| 2002 | 2.3% | 1.8% | 3.9% | 90.2% | 1.8% |
| 2006-2010 | 1.8% | 1.2% | 0.2% | 95.6% | 1.2% |
| 2011-2013 | 1.9% | 2.0% | — | 95.1% | 1.0% |
- 2013
In a study, National Bureau of Economic Research reached the conclusion that the share of the population that is non-heterosexual has been significantly underestimated in surveys utilizing traditional questioning methods, even if anonymous. In this study, it was found that, in all three facets of sexual orientation (identity, attraction, and behavior), the percentage of individuals who recognized themselves as non-heterosexual was larger when the survey method in use was the item randomized response, known to reduce socially desirable responding, in lieu of questions with direct responses. Because the study was, however, based on online volunteer samples, researchers make no suggestion as to the real size of the LGBT population.[41][41][42][42]
- 2013
Writing in the opinion section of The New York Times in 2013, Seth Stephens-Davidowitz estimated that roughly 5 percent of American men are "primarily attracted to men". First, using Facebook data and Gallup poll results, he correlated the percentage of men who are openly gay with their state of birth and residence. Second, he measured what percentage of Google pornographic searches were for gay porn. The first method gave between 1 and 3 percent. The second showed that roughly 5 percent of men search for gay porn in every state. The figure was slightly higher in states considered gay-tolerant than in others.[43]
- 2014 General Social Survey behavior study
A study has also found that, based on the GSS, the proportion of men and women who self-report ever having had a same-sex sexual partner has steadily increased since the early 1990s. In the 1989-1994 period, 4.53% of men and 3.61% of women self-reported homosexual sex ever, which grew to 8.18% of men and 8.74% of women in the 2010-2014 period. The augmentation is mainly due to those who self-report sex with both genders; among those who have only had sex with the same gender, no clear pattern of increase emerged throughout the periods analyzed.[44]
- 2014
The Public Religion Research Institute survey of 2,314 Millennials found that 88% identified as heterosexual, 4% as bisexual, 2% as gay, and 1% as lesbian. In a separate question, 1% identified as transgender. In total, 7% of Millennials identified as LGBT. Three percent refused to identify their sexual orientation. The unaffiliated were more likely to identify as LGBT than the religious, as were Democratic-leaning Millennials compared to the Republican-leaning. No differences were found among the races.[45]
- 2014
In a nationally representative telephone survey of 35,071 Americans, Pew Research found that 1,604, or 4.6%, of the sample identified as gay, lesbian or bisexual, and 32,439 (or 92.4%) as heterosexual, with the remainder refusing or being unable to provide an answer, or identifying as something else.[46]
- 2008-2014 General Social Survey identity polling
| [47] | Gay/lesbian | Bisexual | Total |
|---|---|---|---|
| 2008 | 1.6% | 1.1% | 2.7% |
| 2010 | 1.2% | 1.4% | 2.6% |
| 2012 | 1.5% | 2.2% | 3.7% |
| 2014 | 1.7% | 2.6% | 4.3% |
- 2015
In a Yougov survey of 1,000 adults, 2% of the sample identified as gay male, 2% as gay female, 4% as bisexual (of either sex), and 89% as heterosexual.[48]
- 2016
According to CNN's exit poll of over 24,500 Election Day voters, 5% identify as LGBT.[49]
Footnotes
- 1 2 3
- ↑ Special Report: 3.4% of U.S. Adults Identify as LGBT
- 1 2 3 Gates, Gary J. (April 2011). "How many people are lesbian, gay, bisexual, and transgender?". Williams Institute, University of California School of Law.
- 1 2 Charlotte J. Patterson (Editor); Anthony R. D'Augelli (Editor) (2012). Handbook of Psychology and Sexual Orientation. Oxford University Press. p. 71. ISBN 978-0199765218.
- ↑ Peter J Aspinall (2009). Estimating the size and composition of the lesbian,gay,and bisexual population in Britain (PDF) (Report). p. 13.
The Ellison and Gunstone online survey (2009) for the Commission of over 5,000 people indicates that all methods involving interviewing in a person’s home, whether face-to-face or by telephone, may incur misreporting, especially when another person is present. Respondents report that they would be least likely to conceal their sexual orientation (by switching to another sexual orientation category) when self-completion online surveys are used.
- ↑ "LGBT Percentage Highest in D.C., Lowest in North Dakota". State of the States. Gallup Politics. 15 February 2013. Retrieved 30 June 2013.
- ↑ Numbers are from List of U.S. states and territories by population.
- ↑ "Decennial Census Data on Same Sex Couples". Same Sex Couples. U.S. Census Bureau. Retrieved 30 June 2013..
- ↑ Williams Inst. Census Snapshot http://williamsinstitute.law.ucla.edu/category/research/census-lbgt-demographics-studies/
- ↑ "Decennial Census Data on Same Sex Couples". Same Sex Couples. U.S. Census Bureau. Retrieved 30 June 2013..
- ↑ 76% of Total Population over 18 2010 US Census http://www.census.gov/prod/cen2010/briefs/c2010/br-03.pdf
- ↑ 3.8% of Adult population
- 1 2 3 4 5 Gary J. Gates "Same-sex Couples and the Gay, Lesbian, Bisexual Population: New Estimates from the American Community Survey" (PDF). (2.07 MiB). The Williams Institute on Sexual Orientation Law and Public Policy, UCLA School of Law October, 2006. Retrieved April 20, 2007.
- ↑ Note: the study cited is unclear as to the exact metro NY area that is included; on table 5, page 8, "New York–Northern New Jersey–Long Island" is included, but in Appendix 2, page 15, Pennsylvania also seems to be included as it states "New York–Northern New Jersey–Long Island, New York–NJ–PA"
- ↑ American Community Survey 2000
- 1 2 Gary J. Gates (October 2006). "Same-sex Couples and the Gay, Lesbian, Bisexual Population: New Estimates from the American Community Survey" (PDF). The Williams Institute. The Williams Institute. Retrieved 30 June 2013.
- 1 2 "San Francisco Metro Area Ranks Highest in LGBT Percentage". Gallup.com. Retrieved 2015-10-22.
- ↑ McWhirter, David P., Sanders, Stephanie A., & Reinisch, June Machover(Eds.). (1990). Homosexuality/Heterosexuality: Concepts of Sexual Orientation. The Kinsey Institute Series. New York: Oxford University Press.
- ↑ Laumann, Edward O. (1994). The Social Organization of Sexuality: Sexual Practices in the United States. University of Chicago Press. p. 299. ISBN 978-0-226-47020-7.
- ↑ Dawson, D. & Hardy, A.M. (1990–1992). National Center for Health Statistics, Centers for Disease Control, Advance Data, 204, 1990–1992.
- ↑ Summary of The National Health and Social Life Survey ("The Sex Survey")
- ↑ John O.G. Billy, Koray Tanfer, William R. Grady, and Daniel H. Klepinger, The Sexual Behavior of Men in the United States, Family Planning Perspectives, The Alan Guttmacher Institute, vol. 25, no. 2 (March/April 1993). Guttmacher Institute home page
- ↑ Janus, Samuel S. & Janus, Cynthia L. (1993). The Janus Report on Sexual Behavior. New York: John Wiley & Sons.
- ↑ Laumann, Edward O., Gagnon, John H., Michael, Robert T., and Michaels, Stuart (1994). The Social Organization of Sexuality: Sexual Practices in the United States. Chicago: University of Chicago Press, 297.
- ↑ Turner CF, Ku L, Rogers SM, Lindberg LD, Pleck JH, Sonenstein FL (May 1998). "Adolescent sexual behavior, drug use, and violence: increased reporting with computer survey technology". Science. 280 (5365): 867–73. doi:10.1126/science.280.5365.867. PMID 9572724.
- ↑ The GLBT Market Research Leaders - Hands Down (PDF) (Report). 2011.
- ↑ American Sexual Behavior: Trends, Socio-Demographic Differences, and Risk Behavior
- ↑ Preeti Pathela; Anjum Hajat; Julia Schillinger; Susan Blank; Randall Sell; Farzad Mostashari (2006). "Discordance between Sexual Behavior and Self-Reported Sexual Identity: A Population-Based Survey of New York City Men" (PDF). Annals of Internal Medicine. 145: 416–425. doi:10.7326/0003-4819-145-6-200609190-00005.
- ↑ Fried, Joseph, Democrats and Republicans – Rhetoric and Reality (New York: Algora Publishing, 2008), 10.
- ↑ "Sax on Sex: The emerging science of sex differences". Psychology Today. 3 April 2010. Retrieved 3 April 2010.
- ↑ CNN.com. Retrieved on 2011-02-10.
- ↑ Susan D. Cochran; Frank C. Bandiera; Vickie M. Mays (2013). "Sexual Orientation–Related Differences in Tobacco Use and Secondhand Smoke Exposure Among US Adults Aged 20 to 59 Years: 2003–2010 National Health and Nutrition Examination Surveys". American Journal of Public Health. 103 (10): 1837–1844. doi:10.2105/ajph.2013.301423.
- ↑ National Survey of Sexual Health and Behavior. Nationalsexstudy.indiana.edu. Retrieved on 2010-10-26.
- ↑ http://www.cdc.gov/violenceprevention/pdf/nisvs_sofindings.pdf
- ↑ Gates, Gary J.; Newport, Frank (October 18, 2012). "Special Report: 3.4% of U.S. Adults Identify as LGBT". Gallup.
- ↑ A Survey of LGBT Americans (PDF) (Report). Pew Research. 13 June 2013. p. 24.
- ↑ "Presidential Race - 2012 Election Center - Elections & Politics from CNN.com".
- ↑ Anjani Chandra; et al. (2011). "Sexual Behavior, Sexual Attraction, and Sexual Identity in the United States: Data From the 2006–2008 National Survey of Family Growth". Natl Health Stat Report. Mar 3 (36): 1-36.
- ↑ Anjani Chandra; Casey E. Copen; William D. Mosher (2013). "Sexual Behavior, Sexual Attraction, and Sexual Identity in the United States: Data from the 2006–2010 National Survey of Family Growth". In Amanda K. Baumle. International Handbook on the Demography of Sexuality. 5. Texas A&M University. ISBN 978-94-007-5512-3.
- ↑ Copen CE; et al. (2016). "Sexual Behavior, Sexual Attraction, and Sexual Orientation Among Adults Aged 18-44 in the United States: Data From the 2011-2013 National Survey of Family Growth". Natl Health Stat Report. 2016 Jan 7 (88): 1-14.
- 1 2 Katherine B. Coffman; Lucas C. Coffman; Keith M. Marzilli Ericson (2013). The Size of the LGBT Population and the Magnitude of Anti-Gay Sentiment are Substantially Underestimated (Report).
- 1 2 Rose Eveleth (October 24, 2013). "What Percent of the Population is Gay? More Than You Think". Smithsonian.com.
- ↑ Stephens-Davidowitz, Seth. "How Many American Men Are Gay". nytimes.com. The New York Times. Retrieved 24 August 2014.
- ↑ http://psy2.fau.edu/~shermanr/Gay&LesbianSex5-3-16.pdf
- ↑ Robert P. Jones; Daniel Cox (2015). How race and religion shape Millennial attitudes on sexuality and reproductive health (PDF) (Report).
- ↑ America’s Changing Religious Landscape (PDF) (Report). Pew Research. May 12, 2015. p. 87. Retrieved May 15, 2015.
- ↑ "GSS 1972-2014 Cumulative Datafile".
- ↑ Yougov report (PDF) (Report). Yougov. 21 August 2015.
- ↑ "exit polls". CNN. Retrieved 9 November 2016.