List of Australian states and territories by gross state product
This is the most recent list of Australian states and territories by gross state product (GSP) and GSP per capita. Also included are the GSP and population growth tables as well as a comparison table showing the surplus/deficit between state final demand (SFD) and GSP for the same financial year. All the data were taken from the Australian Bureau of Statistics website.
States and territories by GSP and GSP per capita
| State or territory | GSP[1] (million A$, 2014–15) |
Population[2] (end Jun qtr 2014) |
GSP per capita (A$, 2013–14) |
|---|---|---|---|
| |
506,918 | 7,569,800 | 66,966 |
| |
355,580 | 5,885,800 | 60,413 |
| |
300,270 | 4,750,400 | 63,209 |
| |
276,312 | 2,576,400 | 107,247 |
| |
98,539 | 1,691,600 | 58,253 |
| |
34,866 | 387,500 | 89,975 |
| |
25,419 | 515,300 | 49,329 |
| |
22,450 | 243,700 | 92,107 |
| |
1,620,355 | 23,617,200 | 68,609 |
States and territories by GSP growth
| State or territory | GSP[3] (million A$, 2003–04) |
GSP (million A$, 2013–14) |
Net growth (million A$) |
Growth rate per year |
|---|---|---|---|---|
| |
399,266 | 487,637 | 88,371 | 2.02% |
| |
270,155 | 343,819 | 73,664 | 2.57% |
| |
208,487 | 295,142 | 86,655 | 3.54% |
| |
158,629 | 256,188 | 97,559 | 4.91% |
| |
77,665 | 95,199 | 17,534 | 2.06% |
| |
27,132 | 35,566 | 8,434 | 2.74% |
| |
21,611 | 24,905 | 3,294 | 1.43% |
| |
14,034 | 21,205 | 7,171 | 4.21% |
| |
1,178,187 | 1,559,662 | 381,475 | 2.84% |
States and territories by population growth
| State or territory | Population[4] (end Jun qtr 2004) |
Population (end Jun qtr 2014) |
Net growth | Growth rate per year |
|---|---|---|---|---|
| |
6,731,300 | 7,518,500 | 787,200 | 1.11% |
| |
4,972,800 | 5,841,700 | 868,900 | 1.62% |
| |
3,882,000 | 4,722,400 | 840,400 | 1.98% |
| |
1,982,200 | 2,573,400 | 591,200 | 2.64% |
| |
1,534,300 | 1,685,700 | 151,400 | 0.95% |
| |
324,000 | 386,000 | 62,000 | 1.77% |
| |
482,100 | 514,800 | 32,700 | 0.66% |
| |
199,900 | 245,100 | 45,200 | 2.06% |
| |
20,111,300 | 23,490,700 | 3,379,400 | 1.57% |
States and territories by comparison between SFD and GSP
| State or territory | SFD[5] (million A$, 2014-15) |
GSP (million A$, 2013-14) |
Surplus / deficit |
|---|---|---|---|
| |
486,482 | 487,637 | 26,115 |
| |
370,504 | 343,819 | −9,603 |
| |
313,889 | 295,142 | −19,981 |
| |
214,230 | 256,188 | 42,625 |
| |
100,738 | 95,199 | −2,288 |
| |
58,832 | 35,566 | −22,309 |
| |
28,207 | 24,905 | −2,726 |
| |
31,941 | 21,205 | −7,728 |
| |
1,604,823 | 1,559,662 | 4,107 |
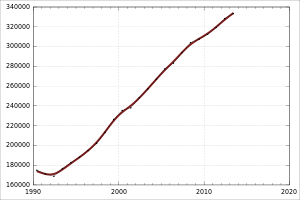
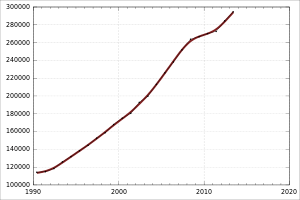
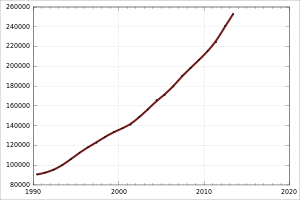
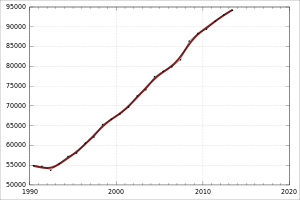
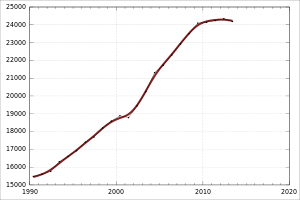
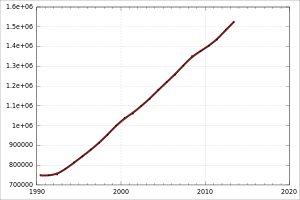
Historical gross state product (1989–90 to 2012–13)
- Gross State Product (million A$) from 1989–90 to 2012–13


See also
- Economy of Australia
- Home-ownership in Australia
- Median household income in Australia and New Zealand
- Ranked list of states and territories of Australia
References
- ↑ "Gross State Product, 2013-14 Financial Year". Australian Bureau of Statistics. Retrieved 15 June 2015.
- ↑ "Australian Demographic Statistics, June 2014". Australian Bureau of Statistics. Retrieved 15 June 2015.
- ↑ "Gross State Product, 2003-04 Financial Year". Australian Bureau of Statistics. Retrieved 15 June 2015.
- ↑ "Australian Demographic Statistics, June 2004". Australian Bureau of Statistics. Retrieved 15 June 2015.
- ↑ "State Final Demand, 2014-15) Financial Year". Australian Bureau of Statistics. Retrieved 15 June 2015.
This article is issued from Wikipedia - version of the 10/7/2016. The text is available under the Creative Commons Attribution/Share Alike but additional terms may apply for the media files.