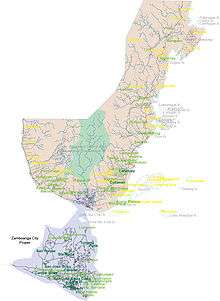
Zamboanga City (98) ninety eight barangays Overview |
| Administration |
Population |
Code and Class |
| District | Official name | Area(ha)[2] | Official 2015 | Official 2010 | Change | Code | Urban/Rural |
| II | Arena Blanco | 51.5717 | 12,589 |
10,016 |
7001256888977635780♠+25.69% | 97332001 | Rural |
| I | Ayala | 529.1303 | 22,547 |
20,096 |
7001121964570063690♠+12.20% | 97332002 | Rural |
| I | Baliwasan | 126.5476 | 25,042 |
27,070 |
2999250831178426300♠−7.49% | 97332004 | Urban |
| I | Baluno | 1,643.4602 | 3,155 |
2,315 |
7001362850971922250♠+36.29% | 97332005 | Rural |
| I | Zone I | 14.7966 | 4,112 |
3,405 |
7001207635829662260♠+20.76% | 97332061 | Rural |
| I | Zone II | 12.9338 | 2,143 |
2,865 |
2998747993019197210♠−25.20% | 97332062 | Rural |
| I | Zone III | 29.0295 | 1,519 |
2,030 |
2998748275862068970♠−25.17% | 97332063 | Rural |
| I | Zone IV | 27.1036 | 1,309 |
3,046 |
2998429743926460930♠−57.03% | 97332064 | Urban |
| II | Boalan | 865.561 | 8,696 |
7,435 |
7001169603227975790♠+16.96% | 97332010 | Urban |
| II | Bolong | 1,574.0594 | 6,460 |
5,862 |
7001102012964858410♠+10.20% | 97332011 | Rural |
| II | Buenavista | 1,003.5189 | 6,485 |
5,837 |
7001111015932842210♠+11.10% | 97332012 | Rural |
| II | Bunguiao | 2,562.0727 | 7,287 |
7,368 |
2999890065146579810♠−1.10% | 97332013 | Rural |
| II | Busay (Sacol Island) | 436.3663 | 3,359 |
2,931 |
7001146025247355850♠+14.60% | 97332014 | Rural |
| II | Cabaluay | 872.2986 | 6,350 |
5,802 |
7000944501895897970♠+9.45% | 97332015 | Rural |
| I | Cabatangan | 896.6494 | 13,680 |
9,944 |
7001375703942075620♠+37.57% | 97332016 | Rural |
| II | Cacao | 1,194.4581 | 1,347 |
1,045 |
7001288995215311000♠+28.90% | 97332017 | Rural |
| II | Calabasa | 1,849.9353 | 3,222 |
2,685 |
7001200000000000000♠+20.00% | 97332018 | Rural |
| I | Calarian | 253.8887 | 28,899 |
25,331 |
7001140855078757250♠+14.09% | 97332019 | Urban |
| I | Camino Nuevo | 68.6803 | 7,739 |
8,295 |
2999329716696805300♠−6.70% | 97332099 | Urban |
| I | Campo Islam | 26.2606 | 12,552 |
11,237 |
7001117024116757140♠+11.70% | 97332020 | Urban |
| I | Canelar | 92.7185 | 11,100 |
11,160 |
3000462365591397850♠−0.54% | 97332021 | Urban |
| I | Capisan | 490.5677 | 1,408 |
1,090 |
7001291743119266060♠+29.17% | 97332098 | Rural |
| I | Cawit | 378.0762 | 9,249 |
9,124 |
7000137001315212630♠+1.37% | 97332022 | Rural |
| II | Culianan | 900.5328 | 8,318 |
8,524 |
2999758329422806190♠−2.42% | 97332023 | Urban |
| II | Curuan | 7,216.0695 | 8,796 |
7,378 |
7001192193006234750♠+19.22% | 97332024 | Urban |
| II | Dita | 133.7222 | 2,085 |
3,831 |
2998544244322631170♠−45.58% | 97332025 | Rural |
| II | Divisoria | 286.2707 | 9,218 |
9,042 |
7000194647201946470♠+1.95% | 97332026 | Rural |
| II | Dulian (Upper Bunguiao) | 1,542.3299 | 2,570 |
2,023 |
7001270390509144830♠+27.04% | 97332027 | Rural |
| I | Dulian (Upper Pasonanca) | 679.6396 | 1,325 |
1,363 |
2999721203228173150♠−2.79% | 97332028 | Rural |
| II | Guisao | 567.3387 | 3,398 |
2,560 |
7001327343750000000♠+32.73% | 97332030 | Rural |
| II | Guiwan | 178.0205 | 14,302 |
15,323 |
2999333681393982900♠−6.66% | 97332031 | Rural |
| II | Kasanyangan | | 14,114 |
8,425 |
7001675252225519290♠+67.53% | 97332101 | Rural |
| I | La Paz | 1,740.0822 | 7,557 |
5,606 |
7001348019978594360♠+34.80% | 97332032 | Urban |
| I | Labuan | 1,961.7203 | 11,457 |
11,470 |
3000886660854402790♠−0.11% | 97332033 | Urban |
| II | Lamisahan | 2,125.8888 | 2,289 |
2,995 |
2998764273789649420♠−23.57% | 97332034 | Rural |
| II | Landang Gua | 589.8559 | 2,993 |
2,980 |
6999436241610738250♠+0.44% | 97332035 | Rural |
| II | Landang Laum | 268.547 | 4,768 |
4,803 |
3000271288777847179♠−0.73% | 97332036 | Rural |
| II | Lanzones | 953.1401 | 3,287 |
2,743 |
7001198323004010210♠+19.83% | 97332037 | Rural |
| II | Lapakan | 955.383 | 1,378 |
1,529 |
2999012426422498369♠−9.88% | 97332038 | Rural |
| II | Latuan (Curuan) | 98.0766 | 2,457 |
2,125 |
7001156235294117650♠+15.62% | 97332039 | Rural |
| II | Licomo | 1,707.8995 | 5,317 |
5,727 |
2999284092893312380♠−7.16% | 97332100 | Rural |
| II | Limaong | 1,853.7832 | 4,000 |
3,445 |
7001161103047895500♠+16.11% | 97332040 | Rural |
| I | Limpapa | 696.3089 | 5,782 |
5,160 |
7001120542635658910♠+12.05% | 97332041 | Rural |
| II | Lubigan | 1,416.7021 | 2,945 |
1,149 |
7002156309834638820♠+156.31% | 97332042 | Rural |
| II | Lumayang | 790.0515 | 1,471 |
1,377 |
7000682643427741470♠+6.83% | 97332043 | Rural |
| II | Lumbangan | 440.1625 | 3,235 |
3,308 |
2999779322853688029♠−2.21% | 97332044 | Rural |
| II | Lunzuran | 742.5246 | 9,931 |
8,221 |
7001208003892470500♠+20.80% | 97332045 | Rural |
| I | Maasin | 556.426 | 8,958 |
7,978 |
7001122837803960890♠+12.28% | 97332046 | Rural |
| I | Malagutay | 627.8804 | 6,657 |
5,654 |
7001177396533427660♠+17.74% | 97332047 | Rural |
| II | Mampang | 726.0937 | 34,312 |
22,857 |
7001501159382246140♠+50.12% | 97332048 | Rural |
| II | Manalipa | 288.4444 | 2,143 |
1,922 |
7001114984391259110♠+11.50% | 97332049 | Rural |
| II | Mangusu | 828.1945 | 4,783 |
4,776 |
6999146566164154090♠+0.15% | 97332050 | Rural |
| II | Manicahan | 1,801.7465 | 10,081 |
9,129 |
7001104283054003720♠+10.43% | 97332051 | Urban |
| I | Mariki | 0.3085 | 1,775 |
5,895 |
2998301102629346900♠−69.89% | 97332052 | Rural |
| II | Mercedes | 1,288.5634 | 14,721 |
12,050 |
7001221659751037340♠+22.17% | 97332053 | Urban |
| II | Muti | 1,233.2268 | 2,983 |
3,123 |
2999551713096381679♠−4.48% | 97332054 | Rural |
| I | Pamucutan | 563.1417 | 4,059 |
3,764 |
7000783740701381510♠+7.84% | 97332055 | Urban |
| II | Pangapuyan | 9.2339 | 590 |
534 |
7001104868913857680♠+10.49% | 97332056 | Rural |
| II | Panubigan | 431.0032 | 1,610 |
982 |
7001639511201629330♠+63.95% | 97332057 | Rural |
| II | Pasilmanta (Sacol Island) | 664.1481 | 2,122 |
1,480 |
7001433783783783780♠+43.38% | 97332058 | Rural |
| II | Pasobolong | | 3,758 |
3,257 |
7001153822536076140♠+15.38% | 97332102 | Rural |
| I | Pasonanca | 1,146.665 | 27,374 |
27,231 |
6999525136792626049♠+0.53% | 97332059 | Urban |
| I | Patalon | 1,400.8893 | 8,128 |
7,187 |
7001130930847363290♠+13.09% | 97332060 | Rural |
| II | Putik | 279.215 | 19,681 |
19,653 |
6999142471887243680♠+0.14% | 97332065 | Rural |
| II | Quiniput | 1,031.6762 | 3,329 |
2,647 |
7001257650170003779♠+25.77% | 97332066 | Rural |
| I | Recodo | 176.6764 | 17,395 |
18,172 |
2999572419106317410♠−4.28% | 97332067 | Urban |
| I | Rio Hondo | 180.372 | 3,326 |
10,565 |
2998314813061997160♠−68.52% | 97332068 | Urban |
| II | Salaan | 1,698.946 | 4,073 |
3,310 |
7001230513595166160♠+23.05% | 97332069 | Rural |
| I | San Jose Cawa-cawa | 36.2309 | 6,173 |
7,991 |
2998772494055812790♠−22.75% | 97332070 | Urban |
| I | San Jose Gusu | 154.6178 | 16,723 |
24,542 |
2998681403308613799♠−31.86% | 97332071 | Urban |
| I | San Roque | 406.6463 | 27,889 |
25,531 |
7000923583095060910♠+9.24% | 97332072 | Urban |
| II | Sangali | 1,259.3212 | 20,766 |
19,230 |
7000798751950078000♠+7.99% | 97332073 | Urban |
| I | Santa Barbara | 14.7966 | 4,762 |
7,961 |
2998598166059540260♠−40.18% | 97332074 | Rural |
| II | Santa Catalina | 54.2083 | 17,294 |
17,955 |
2999631857421331110♠−3.68% | 97332075 | Rural |
| I | Santa Maria | 355.8146 | 25,185 |
21,926 |
7001148636322174590♠+14.86% | 97332076 | Urban |
| I | Santo Niño | 25.0831 | 4,129 |
6,790 |
2998608100147275400♠−39.19% | 97332077 | Rural |
| II | Sibulao (Caruan) | 1,148.7588 | 4,244 |
2,748 |
7001544395924308590♠+54.44% | 97332078 | Rural |
| I | Sinubung | 905.1368 | 4,689 |
2,690 |
7001743122676579930♠+74.31% | 97332079 | Rural |
| I | Sinunuc | 852.8397 | 16,507 |
16,942 |
2999743241647975450♠−2.57% | 97332080 | Urban |
| II | Tagasilay | 1,616.5975 | 2,971 |
2,607 |
7001139624088991180♠+13.96% | 97332081 | Rural |
| II | Taguiti | 1,377.338 | 1,460 |
899 |
7001624026696329250♠+62.40% | 97332082 | Rural |
| II | Talabaan | 891.854 | 5,340 |
4,181 |
7001277206409949770♠+27.72% | 97332083 | Urban |
| I | Talisayan | 3,498.2387 | 8,220 |
7,285 |
7001128345916266300♠+12.83% | 97332084 | Urban |
| II | Talon-talon | 591.8379 | 34,916 |
30,535 |
7001143474701162600♠+14.35% | 97332085 | Urban |
| II | Taluksangay | 25.0707 | 10,237 |
8,108 |
7001262580167735570♠+26.26% | 97332086 | Rural |
| II | Tetuan | 304.2304 | 29,785 |
29,082 |
7000241730279898219♠+2.42% | 97332087 | Urban |
| II | Tictapul | 202.7718 | 3,817 |
3,515 |
7000859174964438119♠+8.59% | 97332088 | Rural |
| II | Tigbalabag | 1,357.9765 | 1,803 |
1,491 |
7001209255533199200♠+20.93% | 97332089 | Rural |
| II | Tigtabon | 22.1714 | 5,292 |
5,071 |
7000435811477026230♠+4.36% | 97332090 | Rural |
| II | Tolosa | 551.3498 | 2,773 |
3,157 |
2998878365536902120♠−12.16% | 97332091 | Rural |
| II | Tugbungan | 380.7098 | 23,837 |
23,001 |
7000363462458153990♠+3.63% | 97332092 | Rural |
| I | Tulungatung | 278.0743 | 9,246 |
6,055 |
7001527002477291490♠+52.70% | 97332093 | Rural |
| I | Tumaga | 273.9979 | 30,824 |
25,184 |
7001223951715374840♠+22.40% | 97332094 | Urban |
| II | Tumalutab | 76.393 | 2,417 |
2,048 |
7001180175781250000♠+18.02% | 97332095 | Rural |
| II | Tumitus | 1,786.5 | 3,026 |
2,494 |
7001213311948676820♠+21.33% | 97332096 | Rural |
| II | Victoria | | 2,802 |
2,326 |
7001204643164230440♠+20.46% | 97332103 | Rural |
| II | Vitali | 5,409.2099 | 9,406 |
8,895 |
7000574480044969080♠+5.74% | 97332097 | Urban |
| II | Zambowood | | 10,166 |
7,627 |
7001332896289497840♠+33.29% | 97332104 | Rural |
| NA | 25/33 other Islands [3] [4] | 6,248.5 | 0000000000000000000♠NA |
0000000000000000000♠NA |
0000000000000000000♠NA | NA | NA |
| Zamboanga City | 861,799 | 807,129 | | | |
| Source: Philippine Statistics Authority 2015 Census August 1, 2015 |
|