List of places in Victoria by population
This is a list of places in the Australian state of Victoria by population.
Urban centres are defined by the Australian Bureau of Statistics as being a population cluster of 1,000 or more people. For statistical purposes, people living in urban centres are classified as urban. The below figures represent the populations of the contiguous built-up areas of each city.
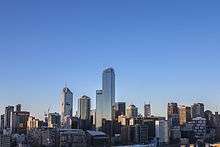
Melbourne, the most populated city in Victoria.
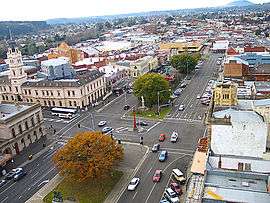
Looking south over Sturt Street and the CBD toward Bridge Mall from Ballarat Town Hall clock tower
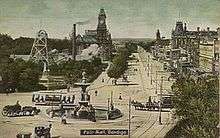
Pall Mall and Charing Cross in 1909. Bendigo had become a bustling city with a large transport network.
| Rank | Urban Centre | Population | |
|---|---|---|---|
| 2006 census[1] | 2016 census[2] | ||
| | Melbourne | 3,371,888 | 4,529,500 |
| | Geelong | 137,220 | 187,417 |
| | Ballarat | 78,221 | 99,841 |
| | Bendigo | 76,051 | 92,888 |
| | Melton | 35,490 | 59,500 |
| | Pakenham | 18,804 | 32,911 |
| | Mildura | 30,016 | 31,361 |
| | Wodonga | 29,710 | 31,605 |
| | Warrnambool | 28,150 | 29,284 |
| | Traralgon | 21,960 | 24,590 |
| | Wangaratta | 16,845 | 17,377 |
| | Ocean Grove-Barwon Heads | 14,125 | 16,093 |
| | Moe-Yallourn | 15,582 | 15,292 |
| | Horsham | 14,125 | 15,292 |
| | Bacchus Marsh | 13,261 | 14,913 |
| | Morwell | 13,399 | 13,691 |
| | Torquay-Jan Juc | 9,851 | 13,339 |
| | Warragul | 11,498 | 13,081 |
| | Sale | 13,336 | 12,766 |
| | Echuca | 12,358 | 12,613 |
| | Bairnsdale | 11,282 | 11,820 |
| | Colac | 10,857 | 11,415 |
| | Lara | 10,525 | 11,192 |
| | Drysdale-Clifton Springs | 10,217 | 10,927 |
| | Portland | 9,820 | 9,950 |
| | Swan Hill | 9,684 | 9,894 |
| | Leopold | 8,160 | 9,608 |
| | Drouin | 6,858 | 9,368 |
| | Hamilton | 9,379 | 9,346 |
| | Benalla | 9,129 | 9,328 |
| | Castlemaine | 7,248 | 9,124 |
| | Gisborne | 6,398 | 8,057 |
| | Healesville | 7,355 | 7,993 |
| | Wallan | 5,410 | 7,811 |
| | Wonthaggi | 6,529 | 7,279 |
| | Maryborough | 7,692 | 7,174 |
| | Ararat | 7,169 | 7,024 |
| | Yarrawonga | 5,727 | 6,793 |
| | Kilmore | 4,721 | 6,142 |
| | Lakes Entrance | 5,548 | 5,965 |
| | Seymour | 6,063 | 5,914 |
| | Stawell | 5,877 | 5,734 |
| | Kyabram | 5,623 | 5,642 |
| | Cobram | 5,063 | 5,420 |
| | Maffra | 4,046 | 5,112 |
| | Leongatha | 4,504 | 4,894 |
| | Churchill | 4,588 | 4,750 |
| | Kyneton | 4,286 | 4,460 |
See also
- Demographics of Australia
- List of cities in Australia
- List of places in South Australia by population
- List of places in Queensland by population
References
- ↑ Australian Bureau of Statistics - Urban Centre/Locality - 2006 Census
- ↑ Australian Bureau of Statistics - Urban Centre/Locality - 2011 Census
| ||||||||||||||||||||||
This article is issued from Wikipedia - version of the 10/17/2016. The text is available under the Creative Commons Attribution/Share Alike but additional terms may apply for the media files.