Maungakiekie (New Zealand electorate)
Maungakiekie is a New Zealand parliamentary electorate, returning one Member of Parliament to the House of Representatives of New Zealand. The current MP for Maungakiekie is Sam Lotu-Iiga of the National Party. The name is from Maungakiekie / One Tree Hill, a large and symbolically important hill at the western end of the seat; the name denotes the presence of kiekie vines on the hill.
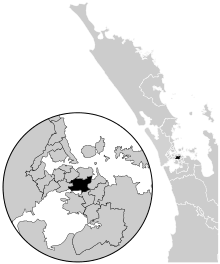
The core of Maungakiekie is the suburbs of Auckland clustered around the Southern Motorway, and the most southern parts of Auckland City facing the Manukau Harbour. As at 2008, these include Penrose, Panmure, Onehunga and Royal Oak. In character, the seat is a minority-majority seat, with a large Māori, Pacific Island and Asian population. It is also quite a young seat, with 46.8 percent of the seat's residents under the age of thirty.
History
Maungakiekie has existed in various forms since its creation ahead of the introduction of Mixed Member Proportional voting in the 1996 election. It was created from merging most of Onehunga with a large section of Panmure, both of them reasonably safe Labour seats. Its original incarnation included both Onehunga and Otahuhu, though for the nine years from 1996, Onehunga was part of Mount Roskill, and from 2008 onwards, Otahuhu formed the northernmost part of Manukau East. The same boundary changes that took Otahuhu out put Panmure in at the expense of Tāmaki.
Because of the area's seats' tendency to vote Labour, and because Labour suffered its worst result since World War II in 1996, with votes splintering off to both the Alliance and New Zealand First, Onehunga MP Richard Northey found himself ousted from Parliament in 1996 at the hands of then unknown National Party candidate Belinda Vernon. Vernon's own party suffered a dramatic reversal of fortune that started at the 1999 election and her three-year term as MP for Maungakiekie ended in favour of Mark Gosche, who held the seat until 2008, notching up a majority of around 6,500 in the intermediate elections.[1] Sam Lotu-Iiga captured the seat again for National in the large swing against Labour in 2008.
Members of Parliament
Unless otherwise stated, all MPs' terms began and ended at general elections.
Key
| Election | Winner | |
|---|---|---|
| 1996 election | Belinda Vernon | |
| 1999 election | Mark Gosche | |
| 2002 election | ||
| 2005 election | ||
| 2008 election | Sam Lotu-Iiga | |
| 2011 election | ||
| 2014 election | ||
List MPs
Members of Parliament elected from party lists in elections where that person also unsuccessfully contested the Maungakiekie electorate. Unless otherwise stated, all MPs terms began and ended at general elections.
| Election | Winner | |
|---|---|---|
| 1996 election | Matt Robson | |
| 1999 election | Matt Robson | |
| Belinda Vernon | ||
| 2008 election | Carol Beaumont | |
Election results
2014 election
| General election 2014: Maungakiekie[2] | |||||||||
|---|---|---|---|---|---|---|---|---|---|
|
Notes: Green background denotes the winner of the electorate vote.
| |||||||||
| Party | Candidate | Votes | % | ±% | Party Votes | % | ±% | ||
| National | |
16,132 | 47.61 | −2.27 | 14,394 | 41.33 | −2.26 | ||
| Labour | Carol Beaumont | 13,784 | 40.68 | +0.11 | 12,199 | 35.02 | −1.83 | ||
| Green | Richard Leckinger | 2,085 | 6.15 | +0.52 | 3,270 | 9.39 | −0.13 | ||
| Conservative | Litia Simpson | 672 | 1.98 | +0.62 | 1,095 | 3.14 | +1.41 | ||
| Mana | Sitaleki Finau | 462 | 1.36 | +0.91 | |||||
| United Future | Bryan Mockridge | 114 | 0.34 | +0.34 | 80 | 0.23 | −0.15 | ||
| Communist League | Felicity Coggan | 92 | 0.27 | +0.27 | |||||
| NZ First | 2,283 | 6.55 | +1.37 | ||||||
| ACT | 512 | 1.47 | +0.29 | ||||||
| Internet Mana | 377 | 1.08 | +0.67[lower-alpha 1] | ||||||
| Māori | 187 | 0.54 | −0.09 | ||||||
| Legalise Cannabis | 113 | 0.32 | −0.06 | ||||||
| Civilian | 14 | 0.04 | +0.04 | ||||||
| Ban 1080 | 11 | 0.03 | +0.03 | ||||||
| Independent Coalition | 10 | 0.03 | +0.03 | ||||||
| Democrats | 8 | 0.02 | ±0.00 | ||||||
| Focus | 8 | 0.02 | +0.02 | ||||||
| Informal votes | 540 | 270 | |||||||
| Total Valid votes | 33,881 | 34,831 | |||||||
| Turnout | 34,831 | 75.23 | +2.56 | ||||||
| National hold | Majority | 2,348 | 6.93 | −2.38 | |||||
2011 election
| General election 2011: Maungakiekie[3] | |||||||||
|---|---|---|---|---|---|---|---|---|---|
|
Notes: Green background denotes the winner of the electorate vote.
| |||||||||
| Party | Candidate | Votes | % | ±% | Party Votes | % | ±% | ||
| National | |
16,189 | 49.88 | +4.33 | 14,747 | 43.59 | +1.11 | ||
| Labour | Carol Beaumont | 13,168 | 40.57 | +0.73 | 12,467 | 36.85 | -2.69 | ||
| Green | Tom Land | 1,827 | 5.63 | +0.81 | 3,220 | 9.52 | +4.04 | ||
| NZ First | Jerry Ho | 687 | 2.12 | +0.26 | 1,753 | 5.18 | +2.23 | ||
| Conservative | Grace Haden | 443 | 1.36 | +1.36 | 585 | 1.73 | +1.73 | ||
| Mana | Barry Tumai | 145 | 0.45 | +0.45 | 140 | 0.41 | +0.41 | ||
| ACT | 400 | 1.18 | -3.35 | ||||||
| Māori | 213 | 0.63 | -0.05 | ||||||
| United Future | 130 | 0.38 | -0.75 | ||||||
| Legalise Cannabis | 128 | 0.38 | +0.08 | ||||||
| Libertarianz | 28 | 0.08 | -0.003 | ||||||
| Alliance | 13 | 0.04 | -0.01 | ||||||
| Democrats | 7 | 0.02 | +0.01 | ||||||
| Informal votes | 890 | 283 | |||||||
| Total Valid votes | 32,349 | 33,891 | |||||||
| National hold | Majority | 3,021 | 9.31 | +3.60 | |||||
Electorate (as at 26 November 2011): 46,637[4]
2008 election
| General election 2008: Maungakiekie[5] | |||||||||
|---|---|---|---|---|---|---|---|---|---|
|
Notes: Green background denotes the winner of the electorate vote.
| |||||||||
| Party | Candidate | Votes | % | ±% | Party Votes | % | ±% | ||
| National | Sam Lotu-Iiga | 15,491 | 45.55 | +13.95 | 14,903 | 42.48 | +9.00 | ||
| Labour | Carol Beaumont | 13,549 | 39.84 | -13.50 | 13,873 | 39.55 | -11.16 | ||
| Green | Rawiri Paratene | 1,639 | 4.82 | +1.78 | 1,921 | 5.48 | |||
| ACT | Athol McQuilkan | 969 | 2.85 | +0.75 | 1,589 | 4.53 | +2.62 | ||
| Progressive | Matt Robson | 756 | 2.22 | -0.32 | 334 | 0.95 | -0.41 | ||
| NZ First | Asenati Lole-Taylor | 630 | 1.85 | -1.37 | 1,035 | 2.95 | -1.24 | ||
| United Future | Denise Krum | 413 | 1.21 | -0.88 | 397 | 1.13 | -0.91 | ||
| Pacific | Darren Jones | 246 | 0.72 | 229 | 0.65 | ||||
| Kiwi | Bernie Ogilvy | 173 | 0.51 | 113 | 0.32 | ||||
| RAM | Elliott Blade | 85 | 0.25 | 21 | 0.06 | ||||
| Communist League | Patrick Brown | 58 | 0.17 | ||||||
| Māori | 239 | 0.68 | +0.08 | ||||||
| Family Party | 132 | 0.38 | |||||||
| Bill and Ben | 126 | 0.36 | |||||||
| Legalise Cannabis | 104 | 0.30 | +0.12 | ||||||
| Libertarianz | 30 | 0.09 | +0.07 | ||||||
| Alliance | 17 | 0.05 | +0.01 | ||||||
| Workers Party | 11 | 0.03 | |||||||
| Democrats | 4 | 0.01 | -0.01 | ||||||
| RONZ | 3 | 0.01 | ±0.00 | ||||||
| Informal votes | 474 | 191 | |||||||
| Total Valid votes | 34,009 | 35,081 | |||||||
| National gain from Labour | Majority | 1,942 | 5.71 | +27.46 | |||||
2005 election
| General election 2005: Maungakiekie[6] | |||||||||
|---|---|---|---|---|---|---|---|---|---|
|
Notes: Green background denotes the winner of the electorate vote.
| |||||||||
| Party | Candidate | Votes | % | ±% | Party Votes | % | ±% | ||
| Labour | |
15,821 | 53.34 | -1.80 | 15,484 | 50.71 | +0.09 | ||
| National | Paul Goldsmith | 9,371 | 31.60 | +1.97 | 10,223 | 33.48 | +16.42 | ||
| NZ First | Joe Williams | 956 | 3.22 | 1,278 | 4.19 | -3.48 | |||
| Green | Paul Quatrough | 901 | 3.04 | -1.26 | 583 | 1.77 | -3.73 | ||
| ACT | Michelle Lorenz | 624 | 2.10 | -1.57 | 584 | 1.91 | -6.55 | ||
| United Future | Bernie Ogilvy | 619 | 2.09 | -1.26 | 623 | 2.04 | -3.81 | ||
| Progressive | Sione Fonua | 564 | 1.90 | +0.46 | 414 | 1.36 | -0.61 | ||
| Māori | Bill Puru | 263 | 0.89 | 184 | 0.60 | ||||
| Independent | Patrick Brown | 54 | 0.18 | ||||||
| Republican | Bevin Berg | 14 | 0.05 | ||||||
| Destiny | 159 | 0.47 | |||||||
| Family Rights | 144 | 0.44 | |||||||
| Legalise Cannabis | 55 | 0.18 | -0.17 | ||||||
| Christian Heritage | 46 | 0.15 | -0.85 | ||||||
| Alliance | 11 | 0.04 | -0.82 | ||||||
| Direct Democracy | 11 | 0.04 | |||||||
| 99 MP | 9 | 0.03 | |||||||
| Democrats | 7 | 0.02 | |||||||
| Libertarianz | 7 | 0.02 | |||||||
| One NZ | 2 | 0.01 | -0.03 | ||||||
| RONZ | 2 | 0.01 | |||||||
| Informal votes | 409 | 149 | |||||||
| Total Valid votes | 29,659 | 30,532 | |||||||
| Labour hold | Majority | 6,450 | 21.75 | -3.76 | |||||
2002 election
| General election 2002: Maungakiekie[7] | |||||||||
|---|---|---|---|---|---|---|---|---|---|
|
Notes: Green background denotes the winner of the electorate vote.
| |||||||||
| Party | Candidate | Votes | % | ±% | Party Votes | % | ±% | ||
| Labour | |
14,273 | 55.14 | +10.65 | 13,491 | 50.62 | +4.18 | ||
| National | Belinda Vernon | 7,670 | 29.63 | -5.90 | 4,547 | 17.06 | -10.59 | ||
| Green | Don Fairley | 1,114 | 4.30 | +0.86 | 1,466 | 5.50 | +1.35 | ||
| ACT | Robin Roodt | 949 | 3.67 | +0.91 | 2,256 | 8.46 | +0.73 | ||
| United Future | Kevin Harper | 867 | 3.35 | 1,558 | 5.85 | ||||
| Progressive | Dawn Patchett | 373 | 1.44 | 524 | 1.97 | ||||
| Christian Heritage | Barry Pepperell | 346 | 1.34 | +0.21 | 266 | 1.00 | |||
| Alliance | Joseph Randall | 222 | 0.86 | -6.62 | 250 | 0.94 | -5.70 | ||
| Communist League | Janet Roth | 72 | 0.28 | ||||||
| NZ First | 2,044 | 7.67 | +4.83 | ||||||
| ORNZ | 129 | 0.48 | |||||||
| Legalise Cannabis | 93 | 0.35 | |||||||
| Mana Māori | 14 | 0.05 | |||||||
| One NZ | 10 | 0.04 | |||||||
| NMP | 3 | 0.01 | |||||||
| Informal votes | 510 | 208 | |||||||
| Total Valid votes | 25,886 | 26,651 | |||||||
| Labour hold | Majority | 6,603 | 25.51 | +16.55 | |||||
1999 election
| General election 1999: Maungakiekie[8][9] | |||||||||
|---|---|---|---|---|---|---|---|---|---|
|
Notes: Green background denotes the winner of the electorate vote.
| |||||||||
| Party | Candidate | Votes | % | ±% | Party Votes | % | ±% | ||
| Labour | Mark Gosche | 12,469 | 44.49 | 13,234 | 46.44 | ||||
| National | |
9,957 | 35.53 | 7,878 | 27.65 | ||||
| Alliance | Matt Robson | 2,096 | 7.48 | 1,891 | 6.64 | ||||
| Green | Jon Carapiet | 964 | 3.44 | 1183 | 4.15 | ||||
| ACT | Angus Ogilvie | 774 | 2.76 | 2,202 | 7.73 | ||||
| NZ First | Gilbert Myles | 734 | 2.62 | 810 | 2.84 | ||||
| Future NZ | Jason Keiller | 387 | 1.38 | 266 | |||||
| Christian Heritage | Mary Paki | 313 | 1.12 | 377 | |||||
| Independent | Sue Henry | 152 | 0.54 | ||||||
| Natural Law | Graeme Lodge | 73 | 0.26 | 69 | |||||
| Independent | Tony Cranston | 67 | 0.24 | ||||||
| Republican | Brian Freeth | 40 | 0.14 | 21 | |||||
| Legalise Cannabis | 178 | ||||||||
| United NZ | 169 | 0.59 | |||||||
| Libertarianz | 63 | ||||||||
| Mauri Pacific | 43 | ||||||||
| Animals First | 39 | ||||||||
| McGillicuddy Serious | 30 | ||||||||
| NMP | 13 | ||||||||
| One NZ | 12 | ||||||||
| Mana Māori | 10 | ||||||||
| People's Choice Party | 3 | ||||||||
| Freedom Movement | 2 | ||||||||
| South Island | 1 | ||||||||
| Total Valid votes | 28,026 | 28,494 | |||||||
| Labour gain from National | Majority | 2,512 | 8.96 | ||||||
1996 election
| General election 1996: Maungakiekie[10][11][12] | |||||||||
|---|---|---|---|---|---|---|---|---|---|
|
Notes: Green background denotes the winner of the electorate vote.
| |||||||||
| Party | Candidate | Votes | % | ±% | Party Votes | % | ±% | ||
| National | Belinda Vernon | 11,621 | 36.24 | 10,351 | 32.03 | ||||
| Labour | |
11,393 | 35.52 | 11,024 | 34.12 | ||||
| NZ First | Gilbert Myles | 4,031 | 12.57 | 3,405 | 10.54 | ||||
| Alliance | Matt Robson | 3,188 | 9.94 | 2,706 | 8.37 | ||||
| ACT | Angus Ogilvie | 965 | 3.01 | 2,317 | 7.17 | ||||
| Progressive Green | Dorothy Bond | 254 | 0.79 | 115 | 0.36 | ||||
| McGillicuddy Serious | John Orchard | 207 | 0.65 | 72 | 0.22 | ||||
| United NZ | Ramparkash Samujh | 200 | 0.62 | 222 | 0.69 | ||||
| Natural Law | Graeme Lodge | 114 | 0.36 | 78 | 0.24 | ||||
| Advance New Zealand | England So'onalole | 66 | 0.21 | 22 | 0.07 | ||||
| Republican | Bill Puru | 32 | 0.10 | ||||||
| Christian Coalition | 1,207 | 3.74 | |||||||
| Legalise Cannabis | 400 | 1.24 | |||||||
| Ethnic Minority Party | 255 | 0.79 | |||||||
| Animals First | 46 | 0.14 | |||||||
| Superannuitants & Youth | 25 | 0.08 | |||||||
| Libertarianz | 17 | 0.05 | |||||||
| Green Society | 15 | 0.05 | |||||||
| Mana Māori | 14 | 0.04 | |||||||
| Conservatives | 14 | 0.04 | |||||||
| Asia Pacific United | 7 | 0.02 | |||||||
| Te Tawharau | 0 | 0.00 | |||||||
| Informal votes | 400 | 159 | |||||||
| Total Valid votes | 32,071 | 32,312 | |||||||
| National win new seat | Majority | 228 | 0.71 | ||||||
Table footnotes
References
- ↑ "Official Count Results -- Maungakiekie". Chief Electoral Office. Retrieved 15 December 2011.
- ↑ "Official Count Results -- Maungakiekie (2014)". Electoral Commission. Retrieved 11 April 2016.
- ↑ 2011 election results
- ↑ "Enrolment statistics". Electoral Commission. 26 November 2011. Retrieved 26 November 2011.
- ↑ 2008 election results
- ↑ 2005 election results
- ↑ 2002 election results
- ↑ "Candidate vote details - Maungakiekie 1999". October 2005.
- ↑ "Votes for registered parties by electorate, 1999". October 2005.
- ↑ "Electorate Candidate and Party Votes Recorded at Each Polling Place - Maungakiekie, 1996" (PDF). Retrieved 20 July 2013.
- ↑ "Part III - Party Lists of Successful Registered Parties" (PDF). Electoral Commission. Retrieved 22 June 2013.
- ↑ "Part III - Party Lists of unsuccessful Registered Parties" (PDF). Electoral Commission. Retrieved 22 June 2013.