Nelson (New Zealand electorate)
Nelson is a New Zealand parliamentary electorate, returning one Member of Parliament to the House of Representatives of New Zealand. From 1853 to 1860, the electorate was called Town of Nelson. From 1860 to 1881, it was City of Nelson. The electorate is the only one that has continuously existed since the 1st Parliament in 1853.
The current MP for Nelson is Nick Smith of the National Party.[1] He has held this position since 1996.
Population centres
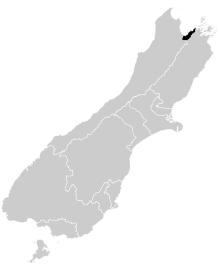
Nelson is based around the city of Nelson, with the dormitory town of Richmond and the smaller communities of Hope and Brightwater drafted in to bring the electorate up to the required population quota.
A significant adjustment to the electorate's boundaries was carried out ahead of the change to Mixed Member Proportional (MMP) voting in 1996; the decrease in South Island electorates from 25 to 16 lead to the abolition of one western South Island electorate; Tasman was split between West Coast and the then (geographically) much smaller Nelson electorate.
The Representation Commission last adjusted the boundaries in the 2007 review, which first applied at the 2008 election;[2] the electorate was not changed in the 2013/14 review.[3]
History
An electorate based on the Nelson has been contested at every election since the first Parliament in 1853. Two of the original 24 electorates from the 1st Parliament still exist (New Plymouth is the other one), but Nelson is the only original electorate that has existed continuously.[4]
The electorate was initially known as Town of Nelson. From 1866 to 1881, it was called City of Nelson. Since 1881, it has been known as simply Nelson.[5]
From 1853 to 1881, Nelson was a two-member electorate.[5] James Mackay and William Travers were the first two representatives elected in 1853. Travers and William Cautley (MP for Waimea) both resigned on 26 May 1854. Travers subsequently contested the seat that Cautley had vacated, being elected in the 21 June 1854 Waimea by-election. Samuel Stephens, who succeeded Travers in Nelson, died before the end of the first term, but the seat remained vacant.
Alfred Domett retired from politics at the end of the 3rd Parliament. Edward Stafford resigned in 1868 during the term of the 4th Parliament. Nathaniel Edwards won the resulting by-election. Martin Lightband resigned after a year in Parliament in 1872 and was succeeded by David Luckie.
Nelson became a single member electorate in 1881. Henry Levestam, who was first elected in an 1881 by-election to replace Adams was confirmed by the voters at the next three general elections (1881, 1884 and 1887), but he died in office on 11 February 1889.[6]
Joseph Harkness won the resulting 1889 by-election and was confirmed in the 1890 election.[7] He retired at the end of the parliamentary term in 1893 and was succeeded by John Graham, who with the 1893 election started a representation of the electorate that would last until his retirement in 1911.[8]
Harry Atmore an Independent Member of Parliament succeeded John Graham in the 1911 election,[9] but he was defeated at the next election in 1914 by Thomas Field of the Reform Party.[10] At the subsequent election in 1919, Atmore defeated Field and represented the electorate until his death on 21 August 1946.[9]
Atmore's death did not cause a by-election, as the 1946 election was held in November of that year. The contest was won by Edgar Neale of the National Party.[11] He held the electorate until 1957, when he retired.
Atmore was succeeded by Stanley Whitehead of the Labour Party in the 1957 election. This started Labour's dominance in the electorate, which was to last for four decades. Whitehead died on 9 January 1976 in the office and this caused the 1976 by-election, which was won by Labour's Mel Courtney. In the 1981 election, Courtney stood as an Independent against Labour's Philip Woollaston, with the latter the successful candidate. Woollaston retired in 1990 and was succeeded by Labour's John Blincoe. When the electorate was enlarged for the 1996 election, it absorbed most of the former seat of Tasman, held by National's Nick Smith. Smith defeated Blincoe and has held the seat ever since.
In the 2014 election, Smith beat Labour's Maryan Street for the third time in a row. Based on preliminary results, Street has also lost the list MP seat that she has had since the 2005 election; she is highest-ranked member on the Labour list who did not get returned to Parliament.[12]
The gap between National and Labour contesting the list vote has narrowed - 43% to 36% in Labour's favour at the 2005 election versus a 45%-19% split three years earlier. Nelson is also an electorate in which the Green Party performs better than the national average - nearly nine percent in 2002 and 7.7 percent in 2005.
Members of Parliament
Key
Independent Conservative Liberal Reform National Labour Green
multi-member electorate
| Election | Winners | |||
|---|---|---|---|---|
| 1853 election | James Mackay | William Travers | ||
| 1854 by-election | Samuel Stephens | |||
| 1855 election | Alfred Domett | Edward Stafford | ||
| 1860 election | ||||
| 1866 election | Oswald Curtis | |||
| 1868 by-election | Nathaniel Edwards[13] | |||
| 1871 election | Martin Lightband[14] | |||
| 1872 by-election | David Mitchell Luckie[15] | |||
| 1875 election | John Sharp[16] | |||
| 1879 by-election | Acton Adams[17] | |||
| 1879 election | Albert Pitt | |||
| 1881 by-election | Henry Levestam | |||
single-member electorate
List MPs
Members of Parliament elected from party lists in elections where that person also unsuccessfully contested the Nelson electorate. Unless otherwise stated, all MPs terms began and ended at general elections.
| Election | Winner | |
|---|---|---|
| 2002 election | Mike Ward | |
| 2008 election | Maryan Street | |
| 2011 election | Maryan Street | |
Election results
2014 election
| General election 2014: Nelson[18] | |||||||||
|---|---|---|---|---|---|---|---|---|---|
|
Notes: Green background denotes the winner of the electorate vote.
| |||||||||
| Party | Candidate | Votes | % | ±% | Party Votes | % | ±% | ||
| National | |
20,000 | 52.82 | −0.32 | 16,904 | 44.28 | −1.13 | ||
| Labour | Maryan Street | 12,395 | 32.73 | +0.11 | 9,401 | 24.63 | −2.70 | ||
| Green | Colin Robertson | 3,449 | 9.11 | −0.37 | 5,381 | 14.10 | −1.95 | ||
| Conservative | John Green | 1,125 | 2.97 | +1.23 | 2,094 | 5.49 | +2.78 | ||
| ACT | Paul Hufflett | 193 | 0.51 | +0.02 | 151 | 0.40 | −0.33 | ||
| Money Free | Richard Osmaston | 175 | 0.46 | +0.46 | |||||
| Democrats | Adrian Bayly | 138 | 0.36 | +0.36 | 47 | 0.12 | +0.02 | ||
| NZ First | 2,918 | 7.64 | +2.22 | ||||||
| Ban 1080 | 386 | 1.01 | +1.01 | ||||||
| Internet Mana | 317 | 0.83 | +0.64[lower-alpha 1] | ||||||
| Legalise Cannabis | 202 | 0.53 | +0.02 | ||||||
| Māori | 125 | 0.33 | −0.13 | ||||||
| United Future | 95 | 0.25 | −0.74 | ||||||
| Civilian | 12 | 0.03 | 0.03 | ||||||
| Independent Coalition | 11 | 0.03 | +0.03 | ||||||
| Focus | 6 | 0.02 | +0.02 | ||||||
| Informal votes | 392 | 124 | |||||||
| Total Valid votes | 37,867 | 38,174 | |||||||
| Turnout | 38,174 | 79.76 | +4.43 | ||||||
| National hold | Majority | 7,605 | 20.08 | −0.44 | |||||
2011 election
| General election 2011: Nelson[19] | |||||||||
|---|---|---|---|---|---|---|---|---|---|
|
Notes: Green background denotes the winner of the electorate vote.
| |||||||||
| Party | Candidate | Votes | % | ±% | Party Votes | % | ±% | ||
| National | |
18,360 | 53.14 | -3.99 | 16,016 | 45.41 | +2.96 | ||
| Labour | Maryan Street | 11,272 | 32.62 | -0.87 | 9,639 | 27.33 | -10.46 | ||
| Green | Aaryn Barlow | 3,276 | 9.48 | +2.21 | 5,660 | 16.05 | +6.61 | ||
| NZ First | Kevin Gardener | 669 | 1.94 | +1.94 | 1,913 | 5.42 | +2.38 | ||
| Conservative | Oliver Vitali | 601 | 1.74 | +1.74 | 954 | 2.71 | +2.71 | ||
| United Future | Doug Stevens | 204 | 0.59 | +0.21 | 348 | 0.99 | -0.08 | ||
| ACT | Paul Charles Hufflett | 171 | 0.49 | -0.36 | 259 | 0.73 | -1.75 | ||
| Legalise Cannabis | 180 | 0.51 | +0.11 | ||||||
| Māori | 161 | 0.46 | -0.05 | ||||||
| Mana | 66 | 0.19 | +0.19 | ||||||
| Democrats | 37 | 0.10 | +0.04 | ||||||
| Libertarianz | 20 | 0.06 | +0.02 | ||||||
| Alliance | 14 | 0.04 | -0.08 | ||||||
| Informal votes | 692 | 250 | |||||||
| Total Valid votes | 34,553 | 35,267 | |||||||
| National hold | Majority | 7,088 | 20.52 | -3.13 | |||||
Electorate (as at 26 November 2011): 46,817[20]
2008 election
| General election 2008: Nelson[21] | |||||||||
|---|---|---|---|---|---|---|---|---|---|
|
Notes: Green background denotes the winner of the electorate vote.
| |||||||||
| Party | Candidate | Votes | % | ±% | Party Votes | % | ±% | ||
| National | |
20,471 | 57.13 | +1.41 | 15,378 | 42.46 | +5.45 | ||
| Labour | Maryan Street | 12,000 | 33.49 | +5.84 | 13,689 | 37.79 | -5.17 | ||
| Green | Diana Mellor | 2,605 | 7.27 | -4.45 | 3,417 | 9.43 | +1.69 | ||
| Kiwi | Robin Westley | 312 | 0.87 | 256 | 0.71 | ||||
| ACT | Paul Hufflett | 306 | 0.85 | +0.45 | 900 | 2.48 | +1.43 | ||
| United Future | Kelvin Deal | 138 | 0.39 | -1.17 | 387 | 1.07 | -2.43 | ||
| NZ First | 1,104 | 3.05 | -1.28 | ||||||
| Progressive | 282 | 0.78 | -0.35 | ||||||
| Bill and Ben | 209 | 0.58 | |||||||
| Māori | 184 | 0.51 | +0.27 | ||||||
| Family Party | 160 | 0.44 | |||||||
| Legalise Cannabis | 144 | 0.40 | +0.12 | ||||||
| Alliance | 42 | 0.12 | +0.03 | ||||||
| Democrats | 24 | 0.07 | ±0.00 | ||||||
| Workers Party | 13 | 0.04 | |||||||
| Libertarianz | 12 | 0.03 | +0.01 | ||||||
| Pacific | 11 | 0.03 | |||||||
| RONZ | 5 | 0.01 | ±0.00 | ||||||
| RAM | 3 | 0.01 | |||||||
| Informal votes | 241 | 115 | |||||||
| Total Valid votes | 35,832 | 36,220 | |||||||
| Turnout | 36,548 | 81.77 | -1.00 | ||||||
| National hold | Majority | 8,471 | 23.64 | -4.43 | |||||
2005 election
| General election 2005: Nelson[22][23] | |||||||||
|---|---|---|---|---|---|---|---|---|---|
|
Notes: Green background denotes the winner of the electorate vote.
| |||||||||
| Party | Candidate | Votes | % | ±% | Party Votes | % | ±% | ||
| National | |
20,299 | 55.72 | +8.45 | 13,619 | 37.01 | +17.68 | ||
| Labour | Jen McCutcheon | 10,073 | 27.65 | -6.94 | 15,809 | 42.96 | -1.96 | ||
| Green | Mike Ward | 4,269 | 11.72 | -0.51 | 2,848 | 7.74 | -1.18 | ||
| United Future | Dennis Wells | 568 | 1.56 | -0.72 | 1,289 | 3.50 | -3.18 | ||
| Destiny | Jason Thomson | 383 | 1.05 | 361 | 0.98 | ||||
| Progressive | Jacqueline McAlpine | 252 | 0.69 | +0.06 | 417 | 1.13 | -0.18 | ||
| Christian Heritage | Nick Barber | 209 | 0.57 | -1.33 | 141 | 0.38 | -1.48 | ||
| Māori | Anne Fitzsimon | 165 | 0.45 | 89 | 0.24 | ||||
| ACT | Mike Heine | 144 | 0.40 | 388 | 1.05 | -2.94 | |||
| Direct Democracy | Rex Newey | 67 | 0.18 | 50 | 0.14 | ||||
| NZ First | 1,593 | 4.33 | -2.04 | ||||||
| Legalise Cannabis | 104 | 0.28 | -0.29 | ||||||
| Alliance | 33 | 0.09 | -1.09 | ||||||
| Democrats | 24 | 0.07 | |||||||
| One NZ | 11 | 0.03 | -0.06 | ||||||
| Libertarianz | 9 | 0.02 | |||||||
| Family Rights | 7 | 0.02 | |||||||
| 99 MP | 6 | 0.02 | |||||||
| RONZ | 4 | 0.01 | ±0.00 | ||||||
| Informal votes | 260 | 113 | |||||||
| Total Valid votes | 36,429 | 36,802 | |||||||
| Turnout | 37,052 | 82.77 | +3.19 | ||||||
| National hold | Majority | 10,226 | 28.07 | +15.39 | |||||
2002 election
| General election 2002: Nelson[23][24] | |||||||||
|---|---|---|---|---|---|---|---|---|---|
|
Notes: Green background denotes the winner of the electorate vote.
| |||||||||
| Party | Candidate | Votes | % | ±% | Party Votes | % | ±% | ||
| National | |
15,779 | 47.27 | +2.49 | 6,517 | 19.33 | -7.70 | ||
| Labour | John Kennedy | 11,547 | 34.59 | +2.83 | 15,149 | 44.92 | +4.30 | ||
| Green | Mike Ward | 4,084 | 12.23 | +2.10 | 3,008 | 8.92 | +0.78 | ||
| United Future | Dennis Wells | 762 | 2.28 | 2,254 | 6.68 | +5.68a | |||
| Christian Heritage | Nick Barber | 635 | 1.90 | -1.20 | 628 | 1.86 | -2.80 | ||
| Alliance | Mary O'Connor | 364 | 1.09 | -6.13 | 398 | 1.18 | -7.74 | ||
| Progressive | Adrian Bayly | 211 | 0.63 | 441 | 1.31 | ||||
| NZ First | 2,147 | 6.37 | +4.27 | ||||||
| ORNZ | 1,602 | 4.75 | |||||||
| ACT | 1,346 | 3.99 | -1.52 | ||||||
| Legalise Cannabis | 193 | 0.57 | -0.13 | ||||||
| One NZ | 30 | 0.09 | -0.01 | ||||||
| NMP | 5 | 0.01 | -0.08 | ||||||
| RONZ | 4 | 0.01 | |||||||
| Mana Māori | 3 | 0.01 | ±0.00 | ||||||
| Informal votes | 286 | 115 | |||||||
| Total Valid votes | 33,382 | 33,721 | |||||||
| Turnout | 33,923 | 79.58 | |||||||
| National hold | Majority | 4,232 | 12.68 | -0.35 | |||||
- a United Future swing is compared to the 1999 results of United NZ and Future NZ, who merged in 2000.
1999 election
| General election 1999: Nelson[23][25][26] | |||||||||
|---|---|---|---|---|---|---|---|---|---|
|
Notes: Green background denotes the winner of the electorate vote.
| |||||||||
| Party | Candidate | Votes | % | ±% | Party Votes | % | ±% | ||
| National | |
15,542 | 44.78 | 9,419 | 27.03 | ||||
| Labour | Simon Fraser | 11,021 | 31.76 | 14,154 | 40.62 | ||||
| Green | Mike Ward | 3,516 | 10.13 | 2,835 | 8.14 | ||||
| Alliance | Mary O'Connor | 2,505 | 7.22 | 3,108 | 8.92 | ||||
| Christian Heritage | Nick Barber | 1,077 | 3.10 | 1,624 | 4.66 | ||||
| ACT | Philip Gully | 461 | 1.33 | 1,920 | 5.51 | ||||
| NZ First | Trevor Squires | 296 | 0.85 | 732 | 2.10 | ||||
| McGillicuddy Serious | Tim Owens | 223 | 0.64 | 95 | 0.27 | ||||
| NMP | Suzanne Johnston | 64 | 0.18 | 32 | 0.09 | ||||
| Legalise Cannabis | 278 | 0.80 | |||||||
| Future NZ | 216 | 0.62 | |||||||
| United NZ | 131 | 0.38 | |||||||
| Libertarianz | 114 | 0.33 | |||||||
| South Island | 67 | 0.19 | |||||||
| Animals First | 51 | 0.15 | |||||||
| One NZ | 34 | 0.10 | |||||||
| Natural Law | 14 | 0.04 | |||||||
| Mana Māori | 5 | 0.01 | |||||||
| People's Choice | 5 | 0.01 | |||||||
| Freedom Movement | 4 | 0.01 | |||||||
| Mauri Pacific | 4 | 0.01 | |||||||
| Republican | 3 | 0.01 | |||||||
| Informal votes | 485 | 345 | |||||||
| Total Valid votes | 34,705 | 34,845 | |||||||
| National hold | Majority | 4,521 | 13.03 | ||||||
1996 election
| General election 1996: Nelson[27][28][29] | |||||||||
|---|---|---|---|---|---|---|---|---|---|
|
Notes: Green background denotes the winner of the electorate vote.
| |||||||||
| Party | Candidate | Votes | % | ±% | Party Votes | % | ±% | ||
| National | Nick Smith | 20,481 | 59.22 | 10,652 | 30.78 | ||||
| Labour | |
8,057 | 23.30 | 11,012 | 31.82 | ||||
| Alliance | Mike Ward | 3,171 | 9.17 | 4,220 | 12.20 | ||||
| NZ First | Bernard Downey | 1,510 | 4.37 | 3,417 | 9.88 | ||||
| Christian Coalition | Nick Barber | 749 | 2.17 | 2,206 | 6.38 | ||||
| McGillicuddy Serious | Tim Owens | 279 | 0.81 | 187 | 0.54 | ||||
| ACT | Graeme Williams | 251 | 0.73 | 1,900 | 5.49 | ||||
| Natural Law | Michelle McGregor | 86 | 0.25 | 59 | 0.17 | ||||
| Legalise Cannabis | 464 | 1.34 | |||||||
| United NZ | 230 | 0.66 | |||||||
| Progressive Green | 94 | 0.27 | |||||||
| Animals First | 62 | 0.18 | |||||||
| Green Society | 26 | 0.08 | |||||||
| Asia Pacific United | 21 | 0.06 | |||||||
| Superannuitants & Youth | 14 | 0.04 | |||||||
| Libertarianz | 13 | 0.04 | |||||||
| Advance New Zealand | 7 | 0.02 | |||||||
| Conservatives | 7 | 0.02 | |||||||
| Mana Māori | 6 | 0.02 | |||||||
| Ethnic Minority Party | 4 | 0.01 | |||||||
| Te Tawharau | 1 | 0.00 | |||||||
| Informal votes | 165 | 147 | |||||||
| Total Valid votes | 34,584 | 34,602 | |||||||
| National gain from Labour | Majority | 12,424 | 35.92 | ||||||
1981 election
| Party | Candidate | Votes | % | ± | |
|---|---|---|---|---|---|
| Labour | Philip Woollaston | 8,198 | 40.41 | ||
| Independent | Mel Courtney | 7,500 | 36.97 | ||
| National | L G H Thompson | 2,749 | 13.55 | ||
| Social Credit | N J L McLean | 1,545 | 7.61 | ||
| Values | Mike Ward | 297 | 1.46 | ||
| Turnout | 20,289 | ||||
| Majority | 698 | 3.44 | |||
1976 by-election
| Party | Candidate | Votes | % | ± | |
|---|---|---|---|---|---|
| Labour | Mel Courtney | 8,418 | 48.4 | ||
| National | Peter Malone | 6,913 | 39.7 | ||
| Values | G J Struik | 1,583 | 9.1 | ||
| Social Credit | R Muller | 452 | 2.6 | ||
| Imperial British Conservative | C P Weallens | 38 | 0.2 | ||
| Majority | 1,505 | 8.7 | |||
| Informal votes | 66 | ||||
| Turnout | 17,470 | 66.0 | |||
| Registered electors | 22,105 | ||||
| Labour hold | Swing | ||||
1931 election
| Party | Candidate | Votes | % | ± | |
|---|---|---|---|---|---|
| Independent | Harry Atmore | 4,749 | 50.53 | -12.44 | |
| Reform | Herbert Everett[32] | 4,649 | 49.47 | ||
| Majority | 100 | 1.06 | -24.89 | ||
| Informal votes | 55 | 0.58 | -0.91 | ||
| Turnout | 9,453 | 89.18 | +0.09 | ||
| Registered electors | 10,600 | ||||
1928 election
| Party | Candidate | Votes | % | ± | |
|---|---|---|---|---|---|
| Independent | Harry Atmore | 5,603 | 62.98 | +4.64 | |
| Reform | F W O Smith | 3,294 | 37.02 | ||
| Majority | 2,309 | 25.95 | -3.07 | ||
| Informal votes | 135 | 1.49 | |||
| Turnout | 9,032 | 89.09 | +3.56 | ||
| Registered electors | 10,138 | ||||
1925 election
| Party | Candidate | Votes | % | ± | |
|---|---|---|---|---|---|
| Independent | Harry Atmore | 4,721 | 58.33 | -4.89 | |
| Reform | A Gilbert | 2,372 | 29.31 | -7.47 | |
| Labour | Tom Brindle | 1,000 | 12.36 | ||
| Majority | 2,349 | 29.03 | +2.58 | ||
| Turnout | 8,093 | 85.53 | -6.33 | ||
| Registered electors | 9,462 | ||||
1899 election
| Party | Candidate | Votes | % | ± | |
|---|---|---|---|---|---|
| Liberal | John Graham | 2,551 | 56.43 | +1.89 | |
| Conservative | Richmond Hursthouse | 1,970 | 43.57 | ||
| Majority | 581 | 12.85 | +3.77 | ||
| Turnout | 4,521 | 84.22 | +3.15 | ||
| Registered electors | 5,368 | ||||
1890 election
| Party | Candidate | Votes | % | ± | |
|---|---|---|---|---|---|
| Conservative | Joseph Harkness | 672 | 47.22 | ||
| Liberal | John Kerr | 657 | 46.17 | ||
| Liberal | Francis William Flowerday | 94 | 6.60 | ||
| Majority | 15 | 1.05 | |||
| Turnout | 1,423 | 77.71 | |||
| Registered electors | 1,831 | ||||
Table footnotes
Notes
- ↑ New Zealand Parliament - Nick Smith MP
- ↑ Report of the Representation Commission 2007 (PDF). Representation Commission. 14 September 2007. p. 9. ISBN 978-0-477-10414-2. Retrieved 26 September 2014.
- ↑ Report of the Representation Commission 2014 (PDF). Representation Commission. 4 April 2014. p. 10. ISBN 978-0-477-10414-2. Retrieved 26 September 2014.
- ↑ Wilson 1985.
- 1 2 Scholefield 1950, p. 161.
- ↑ Scholefield 1950, p. 120.
- ↑ Scholefield 1950, p. 112.
- ↑ Scholefield 1950, p. 109.
- 1 2 Scholefield 1950, p. 94.
- ↑ Scholefield 1950, p. 105.
- ↑ Scholefield 1950, p. 129.
- ↑ Moore, Bill (21 September 2014). "Nick Smith returned as Nelson MP". Stuff.co.nz. Retrieved 27 September 2014.
- ↑ Cyclopedia Company Limited (1906). "Present And Past Members Of Parliament". The Cyclopedia of New Zealand : Nelson, Marlborough & Westland Provincial Districts. Christchurch. Retrieved 4 July 2010.
- ↑ Cyclopedia Company Limited (1906). "Present And Past Members Of Parliament". The Cyclopedia of New Zealand : Nelson, Marlborough & Westland Provincial Districts. Christchurch. Retrieved 4 July 2010.
- ↑ Cyclopedia Company Limited (1906). "Present And Past Members Of Parliament". The Cyclopedia of New Zealand : Nelson, Marlborough & Westland Provincial Districts. Christchurch. Retrieved 4 July 2010.
- ↑ Cyclopedia Company Limited (1906). "Present And Past Members Of Parliament". The Cyclopedia of New Zealand : Nelson, Marlborough & Westland Provincial Districts. Christchurch. Retrieved 4 July 2010.
- ↑ Cyclopedia Company Limited (1906). "Present And Past Members Of Parliament". The Cyclopedia of New Zealand : Nelson, Marlborough & Westland Provincial Districts. Christchurch. Retrieved 4 July 2010.
- ↑ "Official Count Results -- Nelson (2014)". Electoral Commission. Retrieved 11 April 2016.
- ↑ 2011 election results
- ↑ "Enrolment statistics". Electoral Commission. 26 November 2011. Retrieved 27 November 2011.
- ↑ 2008 election results
- ↑ "Official Count Results – Nelson". Elections New Zealand. 2005. Retrieved 7 April 2010.
- 1 2 3 "Electorate Profile Nelson" (PDF). New Zealand Parliamentary Library. October 2005. Retrieved 7 April 2010.
- ↑ "Official Count Results – Nelson". Elections New Zealand. 2002. Retrieved 7 April 2010.
- ↑ "Votes for Registered Parties by Electorate". Elections New Zealand. 1999. Retrieved 7 April 2010.
- ↑ "Elected Candidate Votes by Electorate". Elections New Zealand. 1999. Retrieved 7 April 2010.
- ↑ "Electorate Candidate and Party Votes Recorded at Each Polling Place - Nelson, 1996" (PDF). Retrieved 13 July 2013.
- ↑ "Part III - Party Lists of Successful Registered Parties" (PDF). Electoral Commission. Retrieved 22 June 2013.
- ↑ "Part III - Party Lists of unsuccessful Registered Parties" (PDF). Electoral Commission. Retrieved 22 June 2013.
- ↑ Norton 1988, p. 286.
- ↑ The General Election, 1931. Government Printer. 1932. p. 4. Retrieved 2 November 2014.
- ↑ "Opposing Mr Atmore". The Evening Post. CXII (110). 5 November 1931. p. 10. Retrieved 27 November 2014.
- ↑ The General Election, 1928. Government Printer. 1929. p. 4. Retrieved 4 December 2013.
- ↑ "South Island". Otautau Standard and Wallace County Chronicle. XXI (1055). 10 November 1925. p. 1. Retrieved 5 March 2014.
- ↑ "The General Election, 1899". Wellington: Appendix to the Journals of the House of Representatives. 19 June 1900. p. 2. Retrieved 12 February 2014.
- ↑ "The General Election, 1890". National Library. 1891. Retrieved 25 February 2012.
References
- Norton, Clifford (1988). New Zealand Parliamentary Election Results 1946-1987: Occasional Publications No 1, Department of Political Science. Wellington: Victoria University of Wellington. ISBN 0-475-11200-8.
- Scholefield, Guy (1950) [First ed. published 1913]. New Zealand Parliamentary Record, 1840–1949 (3rd ed.). Wellington: Govt. Printer.
- Wilson, James Oakley (1985) [First ed. published 1913]. New Zealand Parliamentary Record, 1840–1984 (4th ed.). Wellington: V.R. Ward, Govt. Printer. OCLC 154283103.
External links
- Electorate Profile Parliamentary Library