New Plymouth (New Zealand electorate)
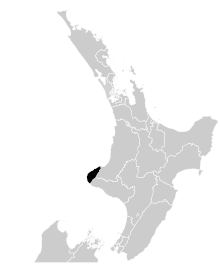
New Plymouth is a New Zealand parliamentary electorate. It was first created for the 1st New Zealand Parliament in 1853 and has existed since, with one 32-year interruption. The electorate was initially called Town of New Plymouth.
The electorate is currently held by Jonathan Young for National,[1] as he defeated Labour's Harry Duynhoven[2] in the 2008 general election.
Population centres
In the 1927 electoral redistribution, the North Island gained a further electorate from the South Island due to faster population growth. Five electorates were abolished, two former electorates, including New Plymouth, were re-established, and three electorates were created for the first time.[3]
The electorate includes the following population centres:
- New Plymouth (53,000)
- Waitara (6,288)
- Oakura (1,359)
- Okato (531)
History
The electorate was originally the Town of New Plymouth from 1853 to 1879. The name of the electorate was changed to New Plymouth from 1879 to 1896. The electorate was abolished in 1896, and was reconstituted under the same name in 1928.[4]
Oliver Samuel, Edward Metcalf Smith, Thomas Kelly (incumbent) and Charles Brown contested the electorate in the 1884 election; Samuel won the contest.[5][6]
The electorate has changed between National and Labour several times, and has been represented by two Christian ministers: Rev Frederick Frost and then Rev Ernest Aderman.
Members of Parliament
Unless otherwise stated, all MPs terms began and ended at a general election.
Key
Independent Liberal United National Labour
List MPs
Members of Parliament elected from party lists in elections where that person also unsuccessfully contested the New Plymouth electorate. Unless otherwise stated, all MPs terms began and ended at general elections.
| Election | Winner | |
|---|---|---|
| 1996 election | Roger Maxwell | |
| 2011 election | Andrew Little | |
| 2014 election | ||
Election results
2014 election
| General election 2014: New Plymouth[10] | |||||||||
|---|---|---|---|---|---|---|---|---|---|
|
Notes: Green background denotes the winner of the electorate vote.
| |||||||||
| Party | Candidate | Votes | % | ±% | Party Votes | % | ±% | ||
| National | |
21,566 | 57.75 | +4.14 | 20,969 | 55.65 | +2.39 | ||
| Labour | Andrew Little | 11,788 | 31.56 | −8.85 | 7,947 | 21.10 | −4.72 | ||
| Green | Sarah Roberts | 2,025 | 5.42 | +1.56 | 3,005 | 7.97 | −1.68 | ||
| Legalise Cannabis | Jamie Dombroski | 701 | 1.88 | +0.55 | 218 | 0.58 | +0.06 | ||
| Conservative | Angela Storr | 633 | 1.69 | +1.69 | 1,201 | 3.19 | +1.22 | ||
| ACT | James Gray | 205 | 0.55 | +0.55 | 172 | 0.46 | −0.56 | ||
| NZ First | 3,395 | 9.00 | +2.70 | ||||||
| Internet Mana | 263 | 0.70 | +0.49[lower-alpha 1] | ||||||
| Māori | 199 | 0.53 | −0.08 | ||||||
| United Future | 66 | 0.18 | −0.27 | ||||||
| Ban 1080 | 57 | 0.15 | +0.15 | ||||||
| Civilian | 57 | 0.15 | +0.15 | ||||||
| Democrats | 28 | 0.07 | +0.01 | ||||||
| Independent Coalition | 10 | 0.03 | +0.03 | ||||||
| Focus | 10 | 0.03 | +0.03 | ||||||
| Informal votes | 429 | 128 | |||||||
| Total Valid votes | 37,347 | 37,681 | |||||||
| Turnout | 37,681 | 77.51 | +2.06 | ||||||
| National hold | Majority | 9,778 | 26.18 | +13.28 | |||||
2011 election
| General election 2011: New Plymouth[11] | |||||||||
|---|---|---|---|---|---|---|---|---|---|
|
Notes: Green background denotes the winner of the electorate vote.
| |||||||||
| Party | Candidate | Votes | % | ±% | Party Votes | % | ±% | ||
| National | |
17,644 | 53.31 | +5.13 | 18,073 | 53.26 | +2.79 | ||
| Labour | Andrew Little | 13,374 | 40.41 | -7.47 | 8,761 | 25.82 | -5.60 | ||
| Green | Geoff Steedman | 1,277 | 3.86 | +3.86 | 3,276 | 9.65 | +3.23 | ||
| Legalise Cannabis | Jamie Dombroski | 439 | 1.33 | +1.33 | 178 | 0.52 | +0.05 | ||
| Independent | Rusty Kane | 361 | 1.09 | -1.11 | |||||
| NZ First | 2,137 | 6.30 | +2.25 | ||||||
| Conservative | 667 | 1.97 | +1.97 | ||||||
| ACT | 347 | 1.02 | -2.16 | ||||||
| Māori | 207 | 0.61 | -0.14 | ||||||
| United Future | 154 | 0.45 | -0.20 | ||||||
| Mana | 72 | 0.21 | +0.21 | ||||||
| Libertarianz | 30 | 0.09 | +0.01 | ||||||
| Democrats | 19 | 0.06 | -0.07 | ||||||
| Alliance | 11 | 0.03 | -0.06 | ||||||
| Informal votes | 808 | 235 | |||||||
| Total Valid votes | 33,095 | 33,932 | |||||||
| National hold | Majority | 4,270 | 12.90 | +12.60 | |||||
Electorate (as at 26 November 2011): 44,973[12]
2008 election
| General election 2008: New Plymouth[13] | |||||||||
|---|---|---|---|---|---|---|---|---|---|
|
Notes: Green background denotes the winner of the electorate vote.
| |||||||||
| Party | Candidate | Votes | % | ±% | Party Votes | % | ±% | ||
| National | Jonathan Young | 16,539 | 48.18 | 17,512 | 50.47 | ||||
| Labour | |
16,434 | 47.88 | 10,901 | 31.42 | ||||
| Independent | Rusty Kane | 756 | 2.20 | ||||||
| ACT | Chris Albers | 455 | 1.33 | 1,106 | 3.19 | ||||
| Libertarianz | Mike Webber | 141 | 0.41 | 27 | 0.08 | ||||
| Green | 2,230 | 6.43 | |||||||
| NZ First | 1,404 | 4.05 | |||||||
| Bill and Ben | 301 | 0.87 | |||||||
| Māori | 260 | 0.75 | |||||||
| Progressive | 232 | 0.67 | |||||||
| United Future | 227 | 0.65 | |||||||
| Legalise Cannabis | 166 | 0.48 | |||||||
| Family Party | 141 | 0.41 | |||||||
| Kiwi | 78 | 0.22 | |||||||
| Democrats | 43 | 0.12 | |||||||
| Alliance | 31 | 0.09 | |||||||
| Pacific | 23 | 0.07 | |||||||
| Workers Party | 13 | 0.04 | |||||||
| RAM | 2 | 0.01 | |||||||
| RONZ | 2 | 0.01 | |||||||
| Informal votes | 349 | 175 | |||||||
| Total Valid votes | 34,325 | 34,699 | |||||||
| National gain from Labour | Majority | 105 | 0.31 | ||||||
2005 election
| Party | Candidate | Votes | % | Party Votes | % |
| Labour | | 17,512 | 53.20 | 12,542 | 37.64 |
| National | Moira Irving | 12,073 | 36.67 | 14,836 | 44.53 |
| Green | Sarah Brown | 1,165 | 3.54 | 1,816 | 5.45 |
| Destiny | Keren Roberts | 555 | 1.69 | 244 | 0.73 |
| United | Matt Collier | 539 | 1.64 | 791 | 2.37 |
| Māori Party | Tony Ruakere | 312 | 0.95 | 148 | 0.44 |
| ACT | Kerry O'Connor | 301 | 0.91 | 394 | 1.18 |
| IND | Rusty Kane | 252 | 0.77 | - | - |
| Democrats | Kevin Smith | 121 | 0.37 | 52 | 0.16 |
| NZ First | - | - | - | 2,036 | 6.11 |
| Progressive | - | - | - | 249 | 0.75 |
| ALCP | - | - | - | 86 | 0.26 |
| Christian Heritage | - | - | - | 36 | 0.11 |
| Alliance | - | - | - | 18 | 0.05 |
| Direct Democracy | - | - | - | 15 | 0.05 |
| Libertarianz | - | - | - | 14 | 0.04 |
| One NZ | - | - | - | 12 | 0.04 |
| Family Rights PP | - | - | - | 11 | 0.03 |
| Republic of NZ | - | - | - | 7 | 0.03 |
| 99 MP | - | - | - | 12 | 0.04 |
| informal votes | 338 | 126 | |||
| total valid votes | 32,919 | 33,319 | |||
| Labour hold | Majority | 5,439 | |||
sourced from electionresults.govt.nz
1996 election
| General election 1996: New Plymouth[14][15][16] | |||||||||
|---|---|---|---|---|---|---|---|---|---|
|
Notes: Green background denotes the winner of the electorate vote.
| |||||||||
| Party | Candidate | Votes | % | ±% | Party Votes | % | ±% | ||
| Labour | |
20,746 | 61.67 | 9,833 | 29.18 | ||||
| National | |
9,213 | 27.39 | 12,185 | 36.16 | ||||
| NZ First | Harry Slaats | 1,771 | 5.26 | 3,999 | 11.87 | ||||
| Alliance | Sue Gaffy | 1,277 | 3.80 | 3,282 | 9.74 | ||||
| ACT | Tony Huston | 391 | 1.16 | 1,492 | 4.43 | ||||
| Progressive Green | Paul O'Neill | 181 | 0.54 | 100 | 0.30 | ||||
| Natural Law | Bruce Sowry | 63 | 0.19 | 48 | 0.14 | ||||
| Christian Coalition | 1,619 | 4.80 | |||||||
| Legalise Cannabis | 642 | 1.91 | |||||||
| United NZ | 223 | 0.66 | |||||||
| McGillicuddy Serious | 93 | 0.28 | |||||||
| Animals First | 77 | 0.23 | |||||||
| Green Society | 21 | 0.06 | |||||||
| Mana Māori | 20 | 0.06 | |||||||
| Conservatives | 19 | 0.06 | |||||||
| Superannuitants & Youth | 14 | 0.04 | |||||||
| Libertarianz | 11 | 0.03 | |||||||
| Ethnic Minority Party | 8 | 0.02 | |||||||
| Advance New Zealand | 7 | 0.02 | |||||||
| Asia Pacific United | 2 | 0.01 | |||||||
| Te Tawharau | 1 | 0.00 | |||||||
| Informal votes | 205 | 151 | |||||||
| Total Valid votes | 33,642 | 33,696 | |||||||
| Labour hold | Majority | 11,533 | 34.28 | ||||||
1931 election
| Party | Candidate | Votes | % | ± | |
|---|---|---|---|---|---|
| United | Sydney George Smith | 7,152 | 66.03 | +15.23 | |
| Labour | William Sheat | 3,680 | 33.97 | ||
| Majority | 3,472 | 32.05 | +18.69 | ||
| Informal votes | 153 | 1.39 | +0.78 | ||
| Turnout | 10,985 | 86.71 | -4.86 | ||
| Registered electors | 12,668 | ||||
1928 election
| Party | Candidate | Votes | % | ± | |
|---|---|---|---|---|---|
| United | Sydney George Smith | 5,577 | 50.79 | ||
| Reform | Charles Bellringer | 4,110 | 37.43 | ||
| Labour | W G Simpson | 1,293 | 11.78 | ||
| Majority | 1,467 | 13.36 | |||
| Informal votes | 68 | 0.62 | |||
| Turnout | 11,048 | 91.57 | |||
| Registered electors | 12,065 | ||||
1893 election
| Party | Candidate | Votes | % | ± | |
|---|---|---|---|---|---|
| Liberal | Edward Metcalf Smith | 1,782 | 55.07 | +15.21 | |
| Conservative | Robert Trimble[21] | 1,291 | 39.89 | ||
| Independent | Richard Price[22] | 163 | 5.04 | ||
| Majority | 491 | 15.17 | +13.47 | ||
| Turnout | 3,236 | 78.73 | +16.60 | ||
| Registered electors | 4,110 | ||||
1890 election
| Party | Candidate | Votes | % | ± | |
|---|---|---|---|---|---|
| Liberal | Edward Metcalf Smith | 539 | 39.86 | ||
| Conservative | John Elliot | 516 | 38.16 | ||
| Independent | R C Hughes | 297 | 21.96 | ||
| Majority | 23 | 1.70 | |||
| Turnout | 1,352 | 62.13 | |||
| Registered electors | 2,176 | ||||
Table footnotes
Notes
- ↑ "Jonathan Young". New Zealand Parliament. Retrieved 25 July 2010.
- ↑ New Zealand Parliament - Harry Duynhoven MP Archived 29 September 2007 at the Wayback Machine.
- ↑ McRobie 1989, pp. 83–88.
- ↑ Scholefield 1950, p. 161.
- ↑ "The General Elections". Taranaki Herald. XXXII (6503). 15 July 1884. p. 2. Retrieved 15 April 2012.
- ↑ "The General Election, 1884". National Library. 1884. pp. 1–3. Retrieved 17 March 2012.
- ↑ Cyclopedia Company Limited (1908). "Former Members Of The House Of Representatives". The Cyclopedia of New Zealand : Taranaki, Hawke’s Bay & Wellington Provincial Districts. Christchurch. Retrieved 20 June 2010.
- ↑ Cyclopedia Company Limited (1908). "Former Members Of The House Of Representatives". The Cyclopedia of New Zealand : Taranaki, Hawke’s Bay & Wellington Provincial Districts. Christchurch. Retrieved 20 June 2010.
- ↑ Cyclopedia Company Limited (1908). "Former Members Of The House Of Representatives". The Cyclopedia of New Zealand : Taranaki, Hawke’s Bay & Wellington Provincial Districts. Christchurch. Retrieved 20 June 2010.
- ↑ "2014 election results". Electoral Commission. 10 October 2014. Retrieved 15 February 2015.
- ↑ 2011 election results
- ↑ "Enrolment statistics". Electoral Commission. 26 November 2011. Retrieved 27 November 2011.
- ↑ 2008 election results
- ↑ "Electorate Candidate and Party Votes Recorded at Each Polling Place - New Plymouth, 1996" (PDF). Retrieved 20 July 2013.
- ↑ "Part III - Party Lists of Successful Registered Parties" (PDF). Electoral Commission. Retrieved 22 June 2013.
- ↑ "Part III - Party Lists of unsuccessful Registered Parties" (PDF). Electoral Commission. Retrieved 22 June 2013.
- ↑ The General Election, 1931. Government Printer. 1932. p. 4. Retrieved 2 November 2014.
- ↑ The General Election, 1928. Government Printer. 1929. p. 4. Retrieved 4 December 2013.
- ↑ The General Election, 1893. Government Printer. 1894. p. 1. Retrieved 19 November 2013.
- ↑ "The General Election". Otago Daily Times. 28 November 1893. p. 6. Retrieved 28 November 2013.
- ↑ "The General Election". Taranaki Herald. XLII (9840). 28 October 1893. p. 2. Retrieved 30 November 2013.
- ↑ "The General Election". Hawera & Normanby Star. XXVI (2586). 20 November 1893. p. 2. Retrieved 30 November 2013.
- ↑ "The General Election, 1890". National Library. 1891. Retrieved 25 February 2012.
References
- McRobie, Alan (1989). Electoral Atlas of New Zealand. Wellington: GP Books. ISBN 0-477-01384-8.
- Scholefield, Guy (1950) [First published in 1913]. New Zealand Parliamentary Record, 1840–1949 (3rd ed.). Wellington: Govt. Printer.
- Wilson, James Oakley (1985) [First published in 1913]. New Zealand Parliamentary Record, 1840–1984 (4th ed.). Wellington: V.R. Ward, Govt. Printer. OCLC 154283103.
External links
- Electorate Profile Parliamentary Library