North-East District (Botswana)
| North-East | |
|---|---|
| District | |
|
Shashe River centre | |
 Location within Botswana | |
| Coordinates: 21°5′S 27°30′E / 21.083°S 27.500°ECoordinates: 21°5′S 27°30′E / 21.083°S 27.500°E | |
| Country |
|
| Capital | Francistown |
| Area | |
| • Total | 5,120 km2 (1,980 sq mi) |
| Population (2013 census) | |
| • Total | 167,500 |
| • Density | 33/km2 (85/sq mi) |
| Time zone | Central Africa Time (UTC+2) |
The North-East District is one of the administrative districts of Botswana. Its capital is Francistown. In 2013, North-East had a population of 167,500 people. The North-East District is predominantly occupied by Kalanga speaking people (the BaKalanga).
In the north and east, North-East borders the Matabeleland South Province of Zimbabwe with the border in the east predominantly the Ramokgwebana River Center. In the south and west, North-East District borders Central District and the border being the Shashe River Center.
The district is administered by a district administration and district council which are responsible for local administration. As of 2011, the total population of the district was 60,264 compared to 49,399 in 2001. The growth rate of population during the decade was 2.01. The total number of workers constituted 14,633 with 7,134 males and 7,498 females.
Geography
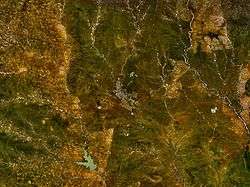
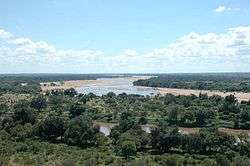
Most part of Botswana has tableland slopes sliding from east to west. The region has an average elevation of around 915 m (3,002 ft) above the mean sea level. The vegetation type is Savannah, with tall grasses, bushes and tress. The annual precipitation is around 65 cm (26 in), most of which is received during the summer season from November to May. Most of the rivers in the region are seasonal, with Limpopo River, which are prone to flash floods, being the most prominent.[1] There are conflicts between agricultural expansion and protection of indigenous wildlife within the Central District. There are several seasonal rivers in the district which flows in the rainy season reach the Makgadikgadi Pans.[2]
The Nata River flows through the North-East District and is a significant gathering place for wildlife including birds.[3] The Nata River continues to flow to the Makgadikgadi Pans, where it discharges.[4]
Demographics
| Historical population | ||
|---|---|---|
| Year | Pop. | ±% |
| 1981 | 36,636 | — |
| 1991 | 43,354 | +18.3% |
| 2001 | 49,399 | +13.9% |
| 2011 | 60,264 | +22.0% |
| Sources:[5] | ||
As of 2011, the total population of the district was 60,264 compared to 49,399 in 2001. The growth rate of population during the decade was 2.01. The population in the district was 2.98 per cent of the total population in the country. The sex ratio stood at 90.30 for every 100 males, compared to 88.29 in 2001. The average house hold size was 3.11 in 2011 compared to 4.55 in 2001. There were 2,426 craft and related workers, 593 clerks, 3,485 people working in elementary occupation 273 Legislators, Administrators & managers 660 Plant & machine operators and assemblers, 331 professionals, 1,247 service workers, shop & market sales workers, 444 skilled agricultural & related workers 730 technicians and assocaited professionals, making the total work force to 10,243.[5]
Education and economy
As of 2011, there were a total of 66 schools in the district, with 6.70 per cent private schools. The total number of students in the Council schools was 24,296, while it was 1,277 in private schools. The total number of students enrolled in the district was 25,572: 12,564 girls and 13,008 boys. The total number of qualified teachers was 1,058, 841 female and 217 male. There were around 34 temporary teachers, 19 male and 53 female. There were no untrained teachers in the district.[6]
As of 2006, 6,881 were involved in agriculture, 1,529 in construction, 1,161 in education, 73 in electricity and water, 61 in finance, 288 in health, 187 in hotels and restaurants, 434 in manufacturing, 784 in mining and quarrying, 97 in other community services, 206 in private households, 1,211 in public administration, 271 in real estate, 156 in transport and communications, and 1,294 in wholesale and retail trade. The total number of workers was 14,633, 7,134 male and 7,498 female.[7]
District administration
In the 2011 Census these villages were listed:Botalaote, Butale, Ditladi, Gambule, Gulubane, Gungwe, Jackalas 1, Jackalas No 2, Kalakamati, Kgari, Letsholathebe, Mabudzane, Makaleng, Mambo, Mapoka, Masingwaneng, Masukwane, Masunga, Matenge, Matopi, Matshelagabedi, Matsiloje, Mbalambi, Moroka, Mosojane, Mowana, Mulambakwena, Nlakhwane, Patayamatebele, Pole, Ramokgwebana, Sechele, Sekakangwe, Senyawe, Shashe Bridge, Siviya, Tati Siding, Themashanga, Toteng, Tsamaya, Tshesebe, Vukwi and Zwenshambe.[8] Francistown and North East are the sub-districts in the region. Botswana gained independence from the British in 1966 and adapted the colonial administration framework to form its district administration. The policies were modified during 1970-74 to address some of the basic issues.[9] The district is administered by a district administration and district council which are responsible for local administration. The policies for the administration are framed by the Ministry of Local Government. The major activities of the council are Tribal Administration, Remote Area Development and Local Governance. The executive powers of the council are vested on a commissioner appointed by the central government. Technical services wing of the Department of Local Government is responsible for developing roads, infrastructure in villages like water supply, schools and recreational facilities.[10] All the staff of the local administration expect District Administration are selected via Unified Local Government Services (ULGS) and the Ministry of Local Government is responsible for their training, deployment and career development.[11]
See also
References
- ↑ Singh (2011). Geography. Tata McGraw-Hill Education. p. 12.53. ISBN 978-0-07-107480-3.
- ↑ Petter, Jan; Hansen, Huberth; Lillethun, Arvid. Resource utilization in the Central District CFDA, Botswana: with special reference to arable farming systems and conflicts in resource management - livestock versus wildlife.
- ↑ Cashdan, Elizabeth (1986). "Competition between Foragers and Food-Producers on the Botletli River, Botswana". Journal of the International African Institute. 56 (3): 299–318.
- ↑ Hogan, C. Michael (2008). Burnham, Andy, ed. Makgadikgadi. The Megalithic Portal.
- 1 2 "Census of Botswana, 2011". Central Statistics Office of Botswana. 2015. Retrieved 12 November 2016.
- ↑ "Education details of Botswana, 2011". Central Statistics Office of Botswana. 2015. Retrieved 12 November 2016.
- ↑ "Labour Force by industry in Botswana, 20006". Central Statistics Office of Botswana. 2008. Retrieved 12 November 2016.
- ↑ "2011 Botswana Population and Housing Census" (PDF). Retrieved 11 September 2013.
- ↑ Picard, Louis A. "Rural Development in Botswana: Administrative Structures and Public Policy". The Journal of Developing Areas. Louis A. Picard. 13 (3). Retrieved 12 November 2016 – via JSTOR. (subscription required (help)).
- ↑ "Regional and Local government in Botswana". Common Wealth of Nations. Retrieved 12 November 2016.
- ↑ UN-HABITAT (2002). Local Democracy and Decentralization in East and Southern Africa: Experiences from Uganda, Kenya, Botswana, Tanzania, and Ethiopia. p. 57. ISBN 9789211316667.