North London
| North London | |
|---|---|
| Boundary Commission area | |
| Coordinates: 51°22′N 0°04′E / 51.36°N 0.06°ECoordinates: 51°22′N 0°04′E / 51.36°N 0.06°E | |
| Sovereign state | United Kingdom |
| Country | England |
| Region | London |
| Comprises | City of London and the London boroughs of Barking and Dagenham, Barnet, Brent, Camden, Ealing, Enfield, Hackney, Hammersmith and Fulham, Haringey, Harrow, Havering, Hillingdon, Hounslow, Islington, Kensington and Chelsea, Newham, Redbridge, Tower Hamlets, Waltham Forest, and Westminster. |
| Area | |
| • Total | 357.62 sq mi (926.22 km2) |
| Population | |
| • Total | 4,721,700 |
| • Density | 13,000/sq mi (5,100/km2) |
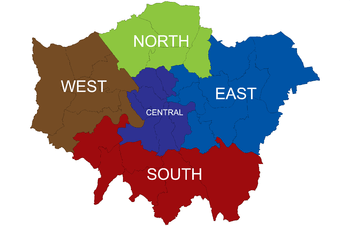
North London is the northern part of London, England. It is an imprecise description and the area it covers is defined differently for a range of purposes. Common to these definitions is that it includes districts north of the River Thames and is used in comparison with south London. However, it is also often used in comparisons with central London, east London and west London.
Boundary Commission
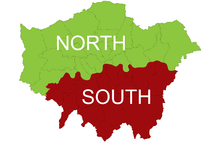
The River Thames divides Greater London into two parts. The northern part includes most of the historic central areas including the City, the East End and the West End; and the majority of the London Underground network.
This area is made up of the City of London and the London boroughs of Barking and Dagenham, Barnet, Brent, Camden, Ealing, Enfield, Hackney, Hammersmith and Fulham, Haringey, Harrow, Havering, Hillingdon, Hounslow, Islington, Kensington and Chelsea, Newham, Redbridge, Tower Hamlets, Waltham Forest, and Westminster. This definition is used by the Boundary Commission for England.[1] The London Borough of Richmond upon Thames includes sections on both sides of the River Thames. The boundary commission class the entire district as part of South London.[2]
In 1965 Camden, Hackney, Hammersmith and Fulham, Islington, Kensington and Chelsea, Tower Hamlets and Westminster were designated Inner London boroughs and Barking and Dagenham, Barnet, Brent, Ealing, Enfield, Haringey, Harrow, Havering, Hillingdon, Hounslow, Newham, Redbridge and Waltham Forest were designated Outer London boroughs.[3]
Subregion
.svg.png)
.svg.png)
For the purposes of the London Plan, there has been a north London subregion in operation since 2004, originally consisting of Barnet, Enfield, Haringey and Waltham Forest.[4] In 2001 this area had a population of 1,042,000.[5] This definition is used by organisations such as Connexions.[6] In 2008 it was amended to consists of Barnet, Camden, Enfield, Hackney, Haringey, Islington and Westminster. In 2011 it was amended again to consist Barnet, Enfield and Haringay.
List of boroughs
This list includes all boroughs included in the Boundary Commission area.
| London borough | Postcode areas | 2008 sub-region | London Assembly[7] | |
|---|---|---|---|---|
| |
Barking and Dagenham | IG, RM, E | North East | City and East |
| |
Barnet | EN, HA, N, NW | North | Barnet and Camden |
| |
Brent | HA, NW, W | West | Brent and Harrow |
| |
Camden | EC, WC, N, NW | North | Barnet and Camden |
| |
Ealing | UB, W, NW | West | Ealing and Hillingdon |
| |
Enfield | EN, N, E | North | Enfield and Haringey |
| |
Hackney | E, EC, N | North | North East |
| |
Hammersmith Fulham | SW, W, NW | West | West Central |
| |
Haringey | N | North | Enfield and Haringey |
| |
Harrow | HA, UB, NW | West | Brent and Harrow |
| |
Havering | RM, CM | North East | Havering and Redbridge |
| |
Hillingdon | HA, TW, UB, WD | West | Ealing and Hillingdon |
| |
Hounslow | TW, W, UB | West | South West |
| |
Islington | EC, WC, N | North | North East |
| |
Kensington and Chelsea | W, SW | West | West Central |
| |
Newham | E, IG | North East | City and East |
| |
Redbridge | E, IG, RM | North East | Havering and Redbridge |
| |
Waltham Forest | E, IG | North East | North East |
| |
Westminster | NW, SW, W | West | West Central |
Climate
North London has, like other parts of London and the UK in general, a temperate maritime climate according to the Köppen climate classification system. Four Met Office weather stations currently collect climate data for London north of the river: Hampstead, Heathrow, Northolt and St James's Park.[8] Long term climate observations dating back to 1910 are available for Hampstead, which also the most elevated Weather Station in the London area, at 137m. This both hilltop and urban position means severe frosts are rare.
As one might expect, temperatures increase towards the Thames, firstly because of the urban warming effect of the surrounding area, but secondly due to altitude decreasing towards the river, meaning some of the hillier northern margins of North London are often a degree or so cooler than those areas adjacent to the Thames. Occasionally snow can be seen to lie towards the Chilterns while central London is snow-free.
Typically the warmest day of the year at Hampstead will average 29.3 °C (84.7 °F)[9] with around 14 days[10] in total achieving a value of 25.1 °C (77.2 °F) or higher.
The average coldest night should fall to −5.6 °C (21.9 °F).[11] On average 35.8 nights[12] will report an air frost, some 119 days[13] of the year will register at least 1mm of precipitation, and on 7.4 days[14] a cover of snow will be observed. All annual averages refer to the observation period 1971–2000.
| Climate data for Hampstead 137m asl 1971–2000 | |||||||||||||
|---|---|---|---|---|---|---|---|---|---|---|---|---|---|
| Month | Jan | Feb | Mar | Apr | May | Jun | Jul | Aug | Sep | Oct | Nov | Dec | Year |
| Record high °C (°F) | 15.7 (60.3) |
18.3 (64.9) |
23.1 (73.6) |
26.6 (79.9) |
29.8 (85.6) |
33.7 (92.7) |
34.4 (93.9) |
37.4 (99.3) |
29.4 (84.9) |
28.3 (82.9) |
17.9 (64.2) |
15.3 (59.5) |
37.4 (99.3) |
| Average high °C (°F) | 6.8 (44.2) |
7.3 (45.1) |
10.1 (50.2) |
12.6 (54.7) |
16.4 (61.5) |
19.2 (66.6) |
22.0 (71.6) |
21.6 (70.9) |
18.2 (64.8) |
14.1 (57.4) |
9.7 (49.5) |
7.7 (45.9) |
13.8 (56.8) |
| Average low °C (°F) | 1.6 (34.9) |
1.4 (34.5) |
3.1 (37.6) |
4.3 (39.7) |
7.4 (45.3) |
10.4 (50.7) |
12.8 (55) |
12.8 (55) |
10.6 (51.1) |
7.5 (45.5) |
4.0 (39.2) |
2.5 (36.5) |
6.53 (43.75) |
| Record low °C (°F) | −10.8 (12.6) |
−12.2 (10) |
−6.9 (19.6) |
−3.2 (26.2) |
−0.6 (30.9) |
1.8 (35.2) |
5.6 (42.1) |
4.7 (40.5) |
2.4 (36.3) |
−2.4 (27.7) |
−5.8 (21.6) |
−8.4 (16.9) |
−12.2 (10) |
| Average precipitation mm (inches) | 64.72 (2.548) |
39.91 (1.5713) |
52.71 (2.0752) |
53.53 (2.1075) |
59.48 (2.3417) |
58.07 (2.2862) |
44.11 (1.7366) |
59.66 (2.3488) |
63.38 (2.4953) |
71.43 (2.8122) |
60.26 (2.3724) |
64.29 (2.5311) |
691.55 (27.2263) |
| Source: Royal Netherlands Meteorological Institute[15] | |||||||||||||
Associated organisations
References
- ↑ Boundary Commission for England - North London Boroughs
- ↑ Boundary Commission for England - South London Boroughs
- ↑ Office of Public Sector Information - London Government Act 1963 (c.33) (as amended)
- ↑ Greater London Authority, The London Plan: Sub-Regional Development Framework - North London
- ↑ Greater London Authority, The London Plan: The Sub Regions
- ↑ Connexions - north London
- ↑ London Assembly - London Assembly Constituency Information. Retrieved on 22 February 2008.
- ↑ "Station Locations". MetOffice.
- ↑ "71-00 Mean Warmest Day". KNMI.
- ↑ "71-00 >25c days". KNMI.
- ↑ "71-00 Mean Coldest night". KNMI.
- ↑ "71-00 Mean Frost Incidence". KNMI.
- ↑ "71-00 Mean Wetdays Incidence". KNMI.
- ↑ "Raw Snow Data". weather-uk.
- ↑ "Hampstead 1971-2000". Royal Netherlands Meteorological Institute. Retrieved 23 Sep 2011.
External links
| Wikivoyage has a travel guide for North London. |
- Time Out editors (1 May 2009). "North London v South London - The debate". Time Out London.
- Alan Rutter and Peter Watts (13 December 2005). "North London v South London - The debate". Time Out London.