Oklahoma's 4th congressional district
| Oklahoma's 4th congressional district | |
|---|---|
|
Oklahoma's 4th congressional district - since January 3, 2013. | |
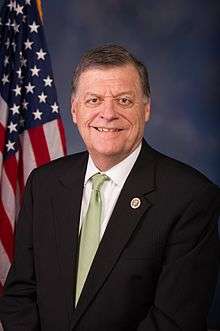
| Current Representative | Tom Cole (R) |
| Distribution |
|
| Population (2010) | 785,424 |
| Median income | 35,510 |
| Ethnicity |
|
| Occupation | |
| Cook PVI | R+18[1] |
.tif.png)
Oklahoma's Fourth Congressional District is located in south-central Oklahoma and covers (in whole or in part) a total of 15 counties. Its principal cities include Midwest City, Norman, Moore, Ada, Duncan, Lawton/Ft. Sill, and Ardmore. The district also includes much of southern Oklahoma City.
The district is currently represented by Republican Tom Cole.
As with the rest of the state, the district gives G.O.P. candidates wide margins - George W. Bush received 61 percent of the vote in 2000, 67% in 2004 and John McCain received 66% of the vote in 2008.
Geography
The district borders Texas along the Red River to the south. To the north, the district includes a very small square-shaped portion of south-central Oklahoma County (enough to capture the city of Midwest City) and then Cleveland, McClain, Grady, Garvin, Pontotoc, Comanche, Tillman, Cotton, Stephens, Jefferson, Carter, Love, and Marshall counties.
Demographics
The district is 63 percent urban, 5 percent Latino, and 3.5 percent foreign-born.[2]
Recent results from statewide elections
| Year | Office | Results |
|---|---|---|
| 2000 | President | Bush 61% - 39% |
| 2004 | President | Bush 67% - 33% |
| 2008 | President | McCain 66% - 34% |
List of representatives


Recent electoral history
| Year | Democrat | Votes | Pct | Republican | Votes | Pct | 3rd Party | Party | Votes | Pct | 4th Party | Party | Votes | Pct | |||||
|---|---|---|---|---|---|---|---|---|---|---|---|---|---|---|---|---|---|---|---|
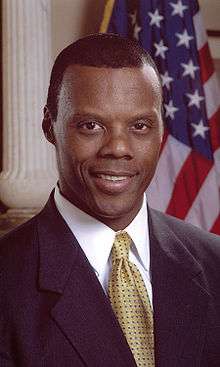
| 1994 | David Perryman | 67,237 | 43% | √ J. C. Watts, Jr. | 80,251 | 52% | Bill Tiffee | Independent | 7,913 | 5% | |||||||||
| 1996 | Ed Crocker | 73,950 | 40% | √ J. C. Watts, Jr. | 106,923 | 58% | Robert Murphy | Libertarian | 4,500 | 2% | |||||||||
| 1998 | Ben Odom | 52,107 | 38% | √ J. C. Watts, Jr. | 83,272 | 62% | |||||||||||||
| 2000 | Larry Weatherford | 54,808 | 31% | √ J. C. Watts, Jr. | 114,000 | 65% | Susan Ducey | Reform | 4,897 | 3% | Keith B. Johnson | Libertarian | 1,979 | 1% | |||||
| 2002 | Darryl Roberts | 91,322 | 46.17% | √ Tom Cole | 106,452 | 53.83% | |||||||||||||
| 2004 | (no candidate) | √ Tom Cole | 198,985 | 77.77% | Charlene K. Bradshaw | Independent | 56,869 | 22.23% | |||||||||||
| 2006 | Hal Spake | 64,775 | 35.39% | √ Tom Cole | 118,266 | 64.61% | |||||||||||||
| 2008 | Blake Cummings | 79,674 | 29.21% | √ Tom Cole | 180,080 | 66.02% | David E. Joyce | Independent | 13,027 | 4.78% | |||||||||
| 2010* | (no candidate) | √ Tom Cole | 32,589 | 77.26% | RJ Harris | Republican | 9,593 | 22.74% | |||||||||||
| 2012 | Donna Marie Bebo | 71,155 | 27.60% | √ Tom Cole | 176,561 | 67.89% | RJ Harris | Independent | 11,725 | 4.51% | |||||||||
| 2014 | Bert Smith | 40,998 | 24.66% | √ Tom Cole | 117,721 | 70.80% | Dennis B. Johnson | Independent | 7,549 | 4.54% | |||||||||
- In 2010, no Democrat or independent candidate filed to run in the district. The results printed here are from the Republican primary, where the election was decided.
Historical district boundaries
See also
References
- ↑ "Partisan Voting Index Districts of the 113th Congress: 2004 & 2008" (PDF). The Cook Political Report. 2012. Retrieved 2013-01-10.
- ↑ District Demographics, That's My Congress (accessed June 1, 2010).
- ↑ "Election Statistics". Office of the Clerk of the House of Representatives. Archived from the original on July 25, 2007. Retrieved March 19, 2009.
- Martis, Kenneth C. (1989). The Historical Atlas of Political Parties in the United States Congress. New York: Macmillan Publishing Company.
- Martis, Kenneth C. (1982). The Historical Atlas of United States Congressional Districts. New York: Macmillan Publishing Company.
- Congressional Biographical Directory of the United States 1774–present
Coordinates: 35°N 98°W / 35°N 98°W