Personal income in the United States
| This article is part of a series on |
| Income in the United States of America |
|---|
 |
|
Lists by income |
|
|
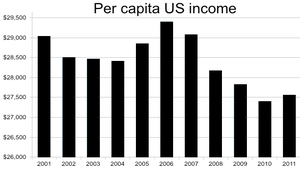
Personal income is an individual's total earnings from wages, investment interest, and other sources. The US Census Bureau reported a median personal income of $30,240 for all workers over age 15 with income, and a mean personal income of $44,510 based on the Current Population Survey for 2015.[2] Inflation-adjusted ("real") per-capita disposable personal income rose steadily in the U.S. from 1945 to 2008, but has since remained generally level.[3][4]
Income patterns are evident on the basis of age, sex, ethnicity and educational characteristics. In 2005 roughly half of all those with graduate degrees were among the nation's top 15% of income earners. Among different demographics (gender, marital status, ethnicity) for those over the age of 18, median personal income ranged from $3,317 for an unemployed, married Asian American female[5] to $55,935 for a full-time, year-round employed Asian American male.[6] According to the US Census, men tended to have higher income than women while Asians and Whites earned more than African Americans and Hispanics.
Income statistics
In the United States the most widely cited personal income statistics are the Bureau of Economic Analysis's personal income and the Census Bureau's per capita money income. The two statistics spring from different traditions of measurement—personal income from national economic accounts and money income from household surveys. BEA's statistics relate personal income to measures of production, including GDP, and is considered an indicator of consumer spending. The Census Bureau's statistics provide detail on income distribution and demographics and are used to produce the nation's official poverty statistics.
Personal income and disposable personal income
BEA's personal income measures the income received by persons from participation in production, from government and business transfers, and from holding interest-bearing securities and corporate stocks. Personal income also includes income received by nonprofit institutions serving households, by private non-insured welfare funds, and by private trust funds. BEA also publishes disposable personal income, which measures the income available to households after paying federal and state and local government income taxes.
Income from production is generated both by the labor of individuals (for example, in the form of wages and salaries and of proprietors' income) and by the capital that they own (in the form of rental income of persons). Income that is not earned from production in the current period—such as capital gains, which relate to changes in the price of assets over time—is excluded.
BEA's monthly personal income estimates are one of several key macroeconomic indicators that the National Bureau of Economic Research considers when dating the business cycle.
Personal income and disposable personal income are provided both as aggregate and as per capita statistics. BEA produces monthly estimates of personal income for the nation, quarterly estimates of state personal income, and annual estimates of local-area personal income. More information is found on BEA's website.
Census Money Income
The Census Bureau collects income data on several major surveys, including the Annual Social and Economic Supplement (ASEC) of the Current Population Survey (CPS), the Survey of Income and Program Participation (SIPP), and the American Community Survey (ACS). The CPS is the source of the official national estimates of poverty and the most widely cited source of annual household income estimates for the United States.[7]
The CPS measure of money income is defined as the total pre-tax cash income received by people on a regular basis, excluding certain lump-sum payments and excluding capital gains.
The Census Bureau also produces alternative estimates of income and poverty based on broadened definitions of income that include many of these income components that are not included in money income.
The Census Bureau releases estimates of household money income as medians, percent distributions by income categories, and on a per capita basis. Estimates are available by demographic characteristics of householders and by the composition of households. More details on income concepts and sources are found on the Census Bureau's website.
By educational attainment
| Measure | Some High School | High school graduate | Some college | Associate's degree | Bachelor's degree or higher | Bachelor's degree | Master's degree | Professional degree | Doctorate degree| |
|---|---|---|---|---|---|---|---|---|---|
| Persons, age 25+ w/ earnings | $17,116 | $25,785 | $30,932 | $35,072 | $55,071 | $49,804 | $61,655 | $91,538 | $79,231 |
| Male, age 25+ w/ earnings | $22,214 | $32,307 | $39,823 | $43,785 | $70,437 | $62,304 | $78,222 | $111,881 | $91,604 |
| Female, age 25+ w/ earnings | $12,768 | $19,810 | $24,512 | $28,664 | $45,170 | $40,115 | $51,494 | $65,012 | $68,887 |
| Persons, age 25+, employed full-time | $30,598 | $38,102 | $43,377 | $47,401 | $71,221 | $64,074 | $77,285 | $117,679 | $101,307 |
Income distribution
Of those individuals with income who were older than 15 years of age, approximately 50% had incomes below $30,000 while the top 10% had incomes exceeding $95,000 a year in 2015.[2] The distribution of income among individuals differs substantially from household incomes as 39% of all households had two or more income earners. As a result, 25% of households have incomes above $100,000,[8] even though only 9.2% of Americans had incomes exceeding $100,000 in 2010.[2]
As a reference point, the US minimum wage since 2009 has been $7.25 per hour or $15,080 for the 2080 hours in a typical work year. The minimum wage is approximately 25% over the official U.S. government-designated poverty income level for a single person unit (before taxes) and about 63% of the designated poverty level for a family of four, assuming only one worker (before taxes). (See Poverty in the United States). Annual wages of $30,160; $45,240; $75,400; $150,800 and $1.5M correspond to 2, 3, 5, 10 and 100 times minimum wage respectively.[9]
| Income range | Number of individuals | Percent in group | Percent at or below | Cumulative percentages | ||
|---|---|---|---|---|---|---|
| Under $2,500 | 14,689,000 | 6.48 | 6.48 | less than $25k 42.87% | less than $50k 70.23% | less than $100k 90.85% |
| $2,500 to $4,999 | 6,262,000 | 2.76 | 9.24 | |||
| $5,000 to $7,499 | 7,657,000 | 3.38 | 12.62 | |||
| $7,500 to $9,999 | 10,551,000 | 4.65 | 17.27 | |||
| $10,000 to $12,499 | 12,474,000 | 5.50 | 22.77 | |||
| $12,500 to $14,999 | 8,995,000 | 3.97 | 26.74 | |||
| $15,000 to $17,499 | 10,672,000 | 4.71 | 31.44 | |||
| $17,500 to $19,999 | 7,931,000 | 3.50 | 34.94 | |||
| $20,000 to $22,499 | 11,301,000 | 4.86 | 39.80 | |||
| $22,500 to $24,999 | 6,962,000 | 3.07 | 42.87 | |||
| $25,000 to $50,000 | ||||||
| $25,000 to $27,499 | 9,623,000 | 4.24 | 47.12 | $25k–$50k 27.36% | ||
| $27,500 to $29,999 | 5,535,000 | 2.44 | 49.56 | |||
| $30,000 to $32,499 | 10,399,000 | 4.59 | 54.15 | |||
| $32,500 to $34,999 | 4,429,000 | 1.95 | 56.10 | |||
| $35,000 to $37,499 | 7,975,000 | 3.52 | 59.62 | |||
| $37,500 to $39,999 | 3,930,000 | 1.73 | 61.35 | |||
| $40,000 to $42,499 | 8,091,000 | 3.57 | 64.92 | |||
| $42,500 to $44,999 | 3,113,000 | 1.37 | 66.29 | |||
| $45,000 to $47,499 | 5,718,000 | 2.52 | 68.81 | |||
| $47,500 to $49,999 | 3,221,000 | 1.42 | 70.23 | |||
| $50,000 to $75,000 | ||||||
| $50,000 to $52,499 | 7,130,000 | 3.14 | 73.38 | $50k–$75k 14.06% | $50k–$100k 20.62% | |
| $52,500 to $54,999 | 2,489,000 | 1.10 | 74.47 | |||
| $55,000 to $57,499 | 3,834,000 | 1.69 | 76.16 | |||
| $57,500 to $59,999 | 2,066,000 | 0.91 | 77.08 | |||
| $60,000 to $62,499 | 5,047,000 | 2.23 | 79.30 | |||
| $62,500 to $64,999 | 1,894,000 | 0.84 | 80.14 | |||
| $65,000 to $67,499 | 3,289,000 | 1.45 | 81.59 | |||
| $67,500 to $69,999 | 1,493,000 | 0.66 | 82.24 | |||
| $70,000 to $72,499 | 3,264,000 | 1.44 | 83.68 | |||
| $72,500 to $74,999 | 1,372,000 | 0.61 | 84.29 | |||
| $75,000 to $100,000 | ||||||
| $75,000 to $77,499 | 2,922,000 | 1.29 | 85.58 | $75k–$100k 6.56% | ||
| $77,500 to $79,999 | 1,307,000 | 0.58 | 86.15 | |||
| $80,000 to $82,499 | 2,725,000 | 1.20 | 87.36 | |||
| $82,500 to $84,999 | 1,021,000 | 0.45 | 87.81 | |||
| $85,000 to $87,499 | 1,508,000 | 0.67 | 88.47 | |||
| $87,500 to $89,999 | 856,000 | 0.38 | 88.85 | |||
| $90,000 to $92,499 | 1,966,000 | 0.87 | 89.72 | |||
| $92,500 to $94,999 | 712,000 | 0.31 | 90.03 | |||
| $95,000 to $97,499 | 1,090,000 | 0.48 | 90.51 | |||
| $97,500 to $99,999 | 768,000 | 0.34 | 90.85 | |||
| $100,000 or more | ||||||
| $100,000 or more | 20,755,000 | 9.15 | 100 | 9.15% | ||
SOURCE: US Census Bureau, Current Population Survey 2016[2]
Over time, by ethnicity and sex
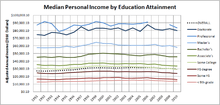
This chart is median income of 15 year olds or older, who have non-zero income.[12] Amounts are shown in nominal dollars and in real dollars in parentheses, 2004 dollars.
| 1950 | 1960 | 1970 | 1980 | 1990 | 2000 | 2004 | ||
|---|---|---|---|---|---|---|---|---|
| Overall | Male | $2,570 ($17,076) | $4,080 ($22,051) | $6,670 ($28,100) | $12,530 ($27,206) | $20,293 ($28,439) | $28,343 ($31,089) | $30,513 |
| Female | $953 ($6,333) | $1,261 ($6,815) | $2,237 ($9,424) | $4,920 ($10,683) | $10,070 ($14,112) | $16,063 ($17,619) | $17,629 | |
| White/European American | Male | $2,709 ($18,001) | $4,296 ($23,219) | $7,011 ($30,536) | $13,328 ($28,939) | $21,170 ($29,668) | $29,797 ($32,684) | $31,335 |
| Female | $1,060 ($7,044) | $1,352 ($7,307) | $2,266 ($9,546) | $4,947 ($10,741) | $10,317 ($14,459) | $16,079 ($17,637) | $17,648 | |
| Black/African American | Male | $1,471 ($9,775) | $2,260 ($12,215) | $4,157 ($17,513) | $8,009 ($17,390) | $12,868 ($18,034) | $21,343 ($23,411) | $22,740 |
| Female | $474 ($3,150) | $837 ($4,524) | $2,063 ($8,691) | $4,580 ($9,944) | $8,328 ($11,671) | $15,581 ($17,420) | $18,379 | |
| Asian | Male | NA | NA | NA | NA | $19,394 ($27,179) | $30,833 ($33,820) | $32,419 |
| Female | NA | NA | NA | NA | $11,086 ($15,536) | $17,356 ($19,038) | $20,618 | |
By ethnicity and origin
Personal income varied significantly with an individual's racial characteristics with racial discrepancies having remained largely stagnant since 1996. Overall, Asian Americans enjoyed higher median personal incomes than any other racial demographic. Asian Americans had a median income roughly ten percent higher than that of Whites.[13] The only exception was among the holders of graduate degrees who constitute 8.9% of the population. Among those with a Master's, Professional or Doctorate degree those who identified as White had the highest median individual income. This racial income gap was relatively small.[13][14]
Those identifying as Hispanic or Latino (who may have been of any "race") had the lowest overall median personal income, earning 28.51% less than Whites[14][15] and 35% less than Asian Americans.[13] The second largest racial or ethnic gap was between Whites and African Americans with the former earning roughly 22% more than the latter. Thus one can observe a significant discrepancy with the median income of Asians and Whites and that of African Americans and Hispanics.[16]
Overall the race gap between African Americans and Whites has remained roughly equal between both races over the past decade.[14][17] Both races saw a gain in median income between 1996 and 2006, with the income growth among African Americans slightly outpacing that of Whites. In 1996 the median income for Whites was $5,957 (31%) higher than for Blacks. In 2006 the gap in median incomes was nearly identical with the median income for Whites being $5,929 (22%) higher than that for African Americans. While the gap remains numerically unchanged, the percentage difference between the two races has decreased as a result of mutual increases in median personal income.[14][17]
Measuring income by per capita is another way to look at personal earnings by race. Unlike median statistics, per capita statistics are affected by extremely high and low incomes. According to the U.S Census Bureau "The per capita income for the overall population in 2008 was $26,964; for non-Hispanic Whites, it was $31,313; for Blacks, it was $18,406; for Asians, it was $30,292; and for Hispanics, it was $15,674."[18]
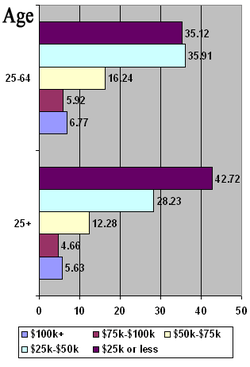
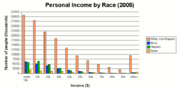 The number of thousands of individuals in each income bracket.
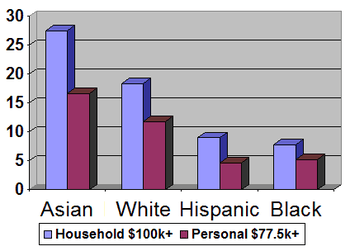 Percent of households with six figure incomes and individuals with incomes in the top 10%, exceeding $77,500.
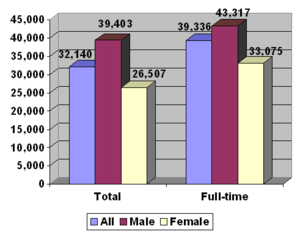
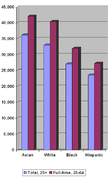 Median personal income by race(note:can be misleading, since "Hispanics" includes people of all racial categories).[19]
| Race | Overall Median | High School | Some College | College Graduate | Bachelor's Degree | Master's Degree | Doctorate Degree | |
|---|---|---|---|---|---|---|---|---|
| Total population | All, age 25+ | 32,140 | 26,505 | 31,054 | 49,303 | 43,143 | 52,390 | 70,853 |
| Full-time workers, age 25-64 | 39,509 | 31,610 | 37,150 | 56,027 | 50,959 | 61,324 | 79,292 | |
| White alone | All, age 25+ | 33,030 | 27,311 | 31,564 | 49,972 | 43,833 | 52,318 | 85,658 |
| Full-time workers, age 25-64 | 40,422 | 32,427 | 38,481 | 56,903 | 51,543 | 61,441 | 77,906 | |
| Asian alone | All, age 25+ | 36,152 | 25,285 | 29,982 | 51,481 | 42,466 | 61,452 | 69,653 |
| Full-time workers, age 25-64 | 42,109 | 27,041 | 33,120 | 60,532 | 51,040 | 71,316 | 91,430 | |
| African American | All, age 25+ | 27,101 | 22,379 | 27,648 | 44,534 | 41,572 | 48,266 | 61,894 |
| Full-time workers, age 25-64 | 32,021 | 26,230 | 32,392 | 47,758 | 45,505 | 52,858 | 73,265 | |
| Hispanic or Latino (of any race) | All, age 25+ | 23,613 | 22,941 | 28,698 | 41,596 | 37,819 | 50,901 | 67,274 |
| Full-time workers, age 25-64 | 27,266 | 26,461 | 33,120 | 46,594 | 41,831 | 53,880 | N/A | |
Source: US Census Bureau, 2006[19]
See also
| Wikimedia Commons has media related to Income distribution in the United States. |
- Adjusted Gross Income which includes AGI by year for the USA.
- Economy of the United States
- Income inequality metrics
References
- ↑ "US Census Bureau, 25+, 2005". Retrieved 2006-12-08.
- 1 2 3 4 5 "PINC-01. Selected Characteristics of People 15 Years and Over, by Total Money Income, Work Experience, Race, Hispanic Origin, and Sex". US Census Bureau. 26 August 2016. Retrieved 18 September 2016.
- ↑ "Real Disposable Personal Income: Per capita" Federal Reserve Bank of St. Louis, 2013
- ↑ "The Rich Are Enjoying The Recovery While Wages Fall For Everyone Else" ThinkProgress, January 25, 2013
- ↑ "US Census Bureau, females, 18 or older, unemployed, personal income, 2005". Retrieved 2006-12-08.
- ↑ "US Census Bureau, male, 18 or older, employed full-time year round, 2005". Retrieved 2006-12-08.
- ↑ "US Census Bureau, Poverty". Retrieved 2011-06-15.
- ↑ US Census Bureau, "Income Distribution to $250,000 or More for Households: 2014". Accessed 2016-09-18. http://www.census.gov/hhes/www/cpstables/032015/hhinc/hinc06.xls
- ↑ "US DOL, Minimum Wage". Retrieved 2010-06-15.
- ↑ "US Census Bureau, distribution of personal income, 2010". Retrieved 2012-03-13.
- ↑ "US Census Bureau, income distribution, ages 25-64, 2006". Retrieved 2012-03-13.
- ↑ Taken from World Almanac (in turn sourced to US Census Bureau)
- 1 2 3 "US Census Bureau, Personal income for Asian Americans, age 25+, 2006". Retrieved 2006-12-17.
- 1 2 3 4 "US Census Bureau, Personal income for Whites, age 25+, 2006". Retrieved 2006-12-17.
- ↑ "US Census Bureau, Personal income for Hispanic Americans, age 25+, 2006". Retrieved 2006-12-17.
- ↑ "US Census Bureau, Personal income for African Americans, age 25+, 2006". Retrieved 2006-12-17.
- 1 2 "US Census Bureau, Personal income by race, age 25+, 1996". Retrieved 2006-12-17.
- ↑ "Income, Poverty, and Health Insurance Coverage in the United States: 2008" (PDF). U.S. Census Bureau. 2009..
- 1 2 "US Census Bureau, Personal income, age 25+, 2006 statistics forum". Retrieved 2006-12-17.
External links
- Census Bureau Personal Income Statistics Forum
- Google - public data: GDP and Personal Income of the U.S. (annual): Personal Income
- Google - public data: GDP and Personal Income of the U.S. (annual): Personal Income per capita
| |||||||||||||||||||||||||||||||||||||||||||||||
| |||||||||||||||||||||||||||||||||||||||||||||||
| |||||||||||||||||||||||||||||||||||||||||||||||
| |||||||||||||||||||||||||||||||||||||||||||||||