Results breakdown of the United States presidential election, 1880
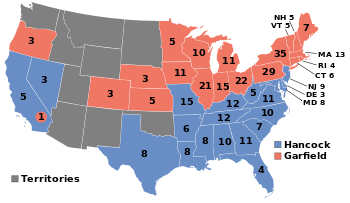
The results of the United States presidential election of 1880 showed a victory for Republican James A. Garfield over Democrat Winfield Scott Hancock in a presidential election held on Tuesday, November 2, 1880. The voter turnout rate was one of the highest in the nation's history. In the end, the popular vote totals of the two main candidates were separated by fewer than 2,000 votes, the smallest victory in the popular vote ever recorded. In the electoral college, however, Garfield's victory was decisive; he won nearly all of the populous Northern states to achieve a majority of 214 electoral votes to 155 for Hancock. Hancock's sweep of the Southern states was not enough for victory, but it cemented his party's dominance of the region for generations. The election of 1880 was the sixth consecutive presidential election won by the Republicans, the second longest winning streak in American history after the Democratic-Republican Party during the period 1800-1824.
Results
Of the 2,320 counties/independent cities making returns, Hancock won in 1,242 (53.53%) while Garfield carried 1,061 (45.73%). In Virginia, nine counties (0.39%) recorded more votes cast for the "Readjuster Democratic" ticket than either of the two-party candidates. Six counties (0.26%) spread across four states recorded a Weaver victory while one county (0.04%) in Arkansas recorded more votes cast for "Scattering" (Non-Democratic/Non-Republican/Non-Greenback-Labor). One county (0.04%) in Indiana split evenly between Hancock and Garfield.
Two Democratic Electoral Tickets were nominated, one by the debt-paying, the other by the "Readjuster" or anti-debt paying faction of the party in Virginia. The "Readjuster" ticket carried 9 counties and received 31,527 votes for 14.89% of the vote.[1]
The merger with the Socialist Labor had broadened the Greenback base. Even though Weaver failed to capture a single electoral vote in this election, the Greenback Labor Party won 6 counties in Iowa (Weaver's home state), Texas (Chambers' home state), Missouri, and Mississippi.
The popular vote at the county level shows that the Democratic Party had a county-level base in the Republican North, Midwest, and West. The Hancock-led Democrats won far more counties (53.5%) than the victorious Republican Party (45.7%). Thus, the Republican Party, even after the Compromise of 1877, had a county base in the South, but it was a much smaller presence than the one that the Democratic Party had in the North. It had dwindled since the 1876 election, particularly in South Carolina.
From the analysis of the county-level map data, there are several major indicators. The Democratic Party at the count level was multi-regional, while the Republican Party was essentially uni-regional, with scattered support in other regions. The Democrats' county-level victories seem to have come from sparsely populated counties, the Republicans' in more densely populated counties.[2] This would explain Hancock's narrow popular vote loss to Garfield despite carrying many more counties.
Although Hancock lost the popular vote, "The Hero of Gettysburg" did carry Adams County, Pennsylvania, with 53.9% of the vote.
To date, this was the closest election ever in terms of popular vote (with a margin of fewer than 10,000) and states carried, as both candidates won 19 states. This election also makes the first (and as of 2014 the only) election in which the two main candidates won the same number of states.
| Presidential candidate | Party | Home state | Popular vote | Electoral vote |
Running mate | |||
|---|---|---|---|---|---|---|---|---|
| Count | Pct | Vice-presidential candidate | Home state | Elect. vote | ||||
| James A. Garfield | Republican | Ohio | 4,453,337 | 48.31% | 214(b) | Chester A. Arthur | New York | 214(b) |
| Winfield Scott Hancock | Democratic | Pennsylvania | 4,444,267 | 48.22% | 155(a) | William Hayden English | Indiana | 155(a) |
| James B. Weaver | Greenback | Iowa | 306,135 | 3.32% | 0 | Benjamin J. Chambers | Texas | 0 |
| Neal S. Dow | Prohibition | Maine | 10,269 | 0.11% | 0 | Henry Adams Thompson | Ohio | 0 |
| John W. Phelps | American | Vermont | 631 | 0.01% | 0 | Samuel C. Pomeroy | Kansas | 0 |
| Other | 2,771 | 0.03% | — | Other | — | |||
| Total | 9,217,410 | 100% | 369 | 369 | ||||
| Needed to win | 185 | 185 | ||||||
Source (Popular Vote): Leip, David. "1880 Presidential Election Results". Dave Leip's Atlas of U.S. Presidential Elections. Retrieved July 27, 2005.
Source (Electoral Vote): "Electoral College Box Scores 1789–1996". National Archives and Records Administration. Retrieved July 31, 2005.
(a) See "Georgia's vote" below.
(b) See "California's vote" below.
-

Results by county, shaded according to winning candidate's percentage of the vote
Results by state
The margin of victory was less than 5% in several states (146 electoral votes):
- California, 0.09%
- New Jersey, 0.82%
- Indiana, 1.41%
- Oregon, 1.63%
- New York, 1.91%
- Connecticut, 2.00%
- Delaware, 3.51%
- North Carolina, 3.56%
- Pennsylvania, 4.26%
- New Hampshire, 4.70%
- Ohio, 4.72%
- Nevada, 4.80%
In several others, the margin of victory was between 5% and 10% (60 electoral votes):
- Colorado, 5.23%
- Maine, 6.14%
- Illinois, 6.54%
- Florida, 8.35%
- Maryland, 8.82%
- Tennessee, 9.00%
- West Virginia, 9.90%
[3]
As of 2012, this is the second and last election where the two leading candidates each carried half of the states. It had previously happened in 1848.
| States won by Garfield/Arthur |
| States won by Hancock/English |
| James Garfield Republican |
Winfield Hancock Democratic |
James Weaver Greenback |
Neal Dow Prohibition |
Margin | State Total | ||||||||||||
|---|---|---|---|---|---|---|---|---|---|---|---|---|---|---|---|---|---|
| State | electoral votes |
# | % | electoral votes |
# | % | electoral votes |
# | % | electoral votes |
# | % | electoral votes |
# | % | # | |
| Alabama | 10 | 56,350 | 37.10 | - | 91,130 | 59.99 | 10 | 4,422 | 2.91 | - | - | - | - | -34,780 | -22.90 | 151,902 | AL |
| Arkansas | 6 | 41,661 | 38.66 | - | 60,489 | 56.13 | 6 | 4,079 | 3.78 | - | - | - | - | -18,828 | -17.47 | 107,772 | AR |
| California | 6 | 80,282 | 48.89 | 1 | 80,426 | 48.98 | 5 | 3,381 | 2.06 | - | 54 | 0.03 | - | -144 | -0.09 | 164,218 | CA |
| Colorado | 3 | 27,450 | 51.26 | 3 | 24,647 | 46.03 | - | 1,435 | 2.68 | - | - | - | - | 2,803 | 5.23 | 53,546 | CO |
| Connecticut | 6 | 67,071 | 50.51 | 6 | 64,411 | 48.50 | - | 868 | 0.65 | - | 409 | 0.31 | - | 2,660 | 2.00 | 132,798 | CT |
| Delaware | 3 | 14,148 | 48.03 | - | 15,181 | 51.53 | 3 | 129 | 0.44 | - | - | - | - | -1,033 | -3.51 | 29,458 | DE |
| Florida | 4 | 23,654 | 45.83 | - | 27,964 | 54.17 | 4 | - | - | - | - | - | - | -4,310 | -8.35 | 51,618 | FL |
| Georgia | 11 | 54,470 | 34.59 | - | 102,981 | 65.41 | 11 | - | - | - | - | - | - | -48,511 | -30.81 | 157,451 | GA |
| Illinois | 21 | 318,036 | 51.11 | 21 | 277,321 | 44.56 | - | 26,358 | 4.24 | - | 440 | 0.07 | - | 40,715 | 6.54 | 622,305 | IL |
| Indiana | 15 | 232,164 | 49.33 | 15 | 225,522 | 47.91 | - | 12,986 | 2.76 | - | - | - | - | 6,642 | 1.41 | 470,672 | IN |
| Iowa | 11 | 183,904 | 56.99 | 11 | 105,845 | 32.80 | - | 32,327 | 10.02 | - | 592 | 0.18 | - | 78,059 | 24.19 | 322,668 | IA |
| Kansas | 5 | 121,549 | 60.40 | 5 | 59,801 | 29.72 | - | 19,851 | 9.86 | - | 10 | 0.00 | - | 61,748 | 30.68 | 201,236 | KS |
| Kentucky | 12 | 106,490 | 39.87 | - | 148,875 | 55.74 | 12 | 11,506 | 4.31 | - | 233 | 0.09 | - | -42,385 | -15.87 | 267,104 | KY |
| Louisiana | 8 | 38,978 | 37.31 | - | 65,047 | 62.27 | 8 | 437 | 0.42 | - | - | - | - | -26,069 | -24.96 | 104,462 | LA |
| Maine | 7 | 74,052 | 51.46 | 7 | 65,211 | 45.32 | - | 4,409 | 3.06 | - | 92 | 0.06 | - | 8,841 | 6.14 | 143,903 | ME |
| Maryland | 8 | 78,515 | 45.59 | - | 93,706 | 54.41 | 8 | - | - | - | - | - | - | -15,191 | -8.82 | 172,221 | MD |
| Massachusetts | 13 | 165,198 | 58.53 | 13 | 111,720 | 39.58 | - | 4,548 | 1.61 | - | 682 | 0.24 | - | 53,478 | 18.95 | 282,265 | MA |
| Michigan | 11 | 185,335 | 52.49 | 11 | 131,597 | 37.27 | - | 34,895 | 9.88 | - | 940 | 0.27 | - | 53,738 | 15.22 | 353,079 | MI |
| Minnesota | 5 | 93,902 | 62.28 | 5 | 53,315 | 35.36 | - | 3,267 | 2.17 | - | 286 | 0.19 | - | 40,587 | 26.92 | 150,770 | MN |
| Mississippi | 8 | 34,844 | 29.76 | - | 75,750 | 64.71 | 8 | 5,797 | 4.95 | - | - | - | - | -40,906 | -34.94 | 117,068 | MS |
| Missouri | 15 | 153,647 | 38.67 | - | 208,600 | 52.51 | 15 | 35,042 | 8.82 | - | - | - | - | -54,953 | -13.83 | 397,289 | MO |
| Nebraska | 3 | 54,979 | 62.87 | 3 | 28,523 | 32.62 | - | 3,950 | 4.52 | - | - | - | - | 26,456 | 30.25 | 87,452 | NE |
| Nevada | 3 | 8,732 | 47.60 | - | 9,613 | 52.40 | 3 | - | - | - | - | - | - | -881 | -4.80 | 18,345 | NV |
| New Hampshire | 5 | 44,856 | 51.94 | 5 | 40,797 | 47.24 | - | 528 | 0.61 | - | 180 | 0.21 | - | 4,059 | 4.70 | 86,361 | NH |
| New Jersey | 9 | 120,555 | 49.02 | - | 122,565 | 49.84 | 9 | 2,617 | 1.06 | - | 191 | 0.08 | - | -2,010 | -0.82 | 245,928 | NJ |
| New York | 35 | 555,544 | 50.32 | 35 | 534,511 | 48.42 | - | 12,373 | 1.12 | - | 1,517 | 0.14 | - | 21,033 | 1.91 | 1,103,945 | NY |
| North Carolina | 10 | 115,616 | 47.98 | - | 124,204 | 51.55 | 10 | 1,126 | 0.47 | - | - | - | - | -8,588 | -3.56 | 240,946 | NC |
| Ohio | 22 | 375,048 | 51.73 | 22 | 340,821 | 47.01 | - | 6,456 | 0.89 | - | 2,616 | 0.36 | - | 34,227 | 4.72 | 724,967 | OH |
| Oregon | 3 | 20,619 | 50.51 | 3 | 19,955 | 48.88 | - | 249 | 0.61 | - | - | - | - | 664 | 1.63 | 40,823 | OR |
| Pennsylvania | 29 | 444,704 | 50.84 | 29 | 407,428 | 46.57 | - | 20,668 | 2.36 | - | 1,939 | 0.22 | - | 37,276 | 4.26 | 874,783 | PA |
| Rhode Island | 4 | 18,195 | 62.24 | 4 | 10,779 | 36.87 | - | 236 | 0.81 | - | 20 | 0.07 | - | 7,416 | 25.37 | 29,235 | RI |
| South Carolina | 7 | 57,954 | 34.13 | - | 111,236 | 65.51 | 7 | 567 | 0.33 | - | - | - | - | -53,282 | -31.38 | 169,793 | SC |
| Tennessee | 12 | 107,677 | 44.26 | - | 129,569 | 53.26 | 12 | 6,017 | 2.47 | - | - | - | - | -21,892 | -9.00 | 243,263 | TN |
| Texas | 8 | 57,893 | 23.95 | - | 156,428 | 64.71 | 8 | 27,405 | 11.34 | - | - | - | - | -98,535 | -40.76 | 241,726 | TX |
| Vermont | 5 | 45,091 | 69.81 | 5 | 18,182 | 28.15 | - | 1,212 | 1.88 | - | - | - | - | 26,909 | 41.66 | 64,594 | VT |
| Virginia | 11 | 83,533 | 39.47 | - | 128,083 | 60.53 | 11 | - | - | - | - | - | - | -44,550 | -21.05 | 211,616 | VA |
| West Virginia | 5 | 46,243 | 41.05 | - | 57,390 | 50.95 | 5 | 9,008 | 8.00 | - | - | - | - | -11,147 | -9.90 | 112,641 | WV |
| Wisconsin | 10 | 144,398 | 54.04 | 10 | 114,644 | 42.91 | - | 7,986 | 2.99 | - | 68 | 0.03 | - | 29,754 | 11.14 | 267,187 | WI |
| TOTALS: | 369 | 4,453,337 | 48.31 | 214 | 4,444,267 | 48.22 | 155 | 306,135 | 3.32 | - | 10,269 | 0.11 | - | 9,070 | 0.10 | 9,217,410 | US |
Georgia's vote
According to Article II, Section 1, clause 3 of the Constitution, "The Congress may determine the Time of choosing the Electors, and the Day on which they shall give their Votes; which Day shall be the same throughout the United States." In 1792, Congress had set the date for the Electoral College to vote at the first Wednesday in December, and it was still set to that day in 1880, when it fell on December 1. However, Georgia's electors failed to cast their ballots on December 1, instead voting on the following Wednesday, December 8. Congress chose to count Georgia's vote in the official tally, but it is arguable that Georgia's electoral vote was constitutionally invalid, and thus that Hancock's electoral vote should have been 144, not 155.
California's vote
In this year, California's electoral votes were split between the two candidates, with Garfield getting one and Hancock getting five, giving Garfield nineteen states plus one electoral vote. It is speculated that Garfield lost electoral votes in California due to a letter written by Senator James G. Blaine, Garfield's primary supporter, before the election that allegedly favored Chinese immigration. Many in the western states were against Chinese immigration, claiming that the Chinese were limiting the growth of the Pacific coast.[4]
Garfield won the presidency without simultaneously winning California. No Republican presidential candidate managed to reproduce this feat until George W. Bush in 2000, 120 years later.
Maps
-
Map of presidential election results by county.
-

Map of Republican presidential election results by county.
-

Map of Democratic presidential election results by county.
-

Map of "other" presidential election results by county.
-

Cartogram of presidential election results by county.
-

Cartogram of Republican presidential election results by county.
-

Cartogram of Democratic presidential election results by county.
-

Cartogram of "other" presidential election results by county.
References
- ↑ Spofford, Ainsworth R. An American Almanac and Treasury of Facts, Statistical, Financial, and Political, for the year 1882, p. 267
- ↑ Presidential Elections, 1789-2008: County, State, and National Mapping of Election Data, Donald R. Deskins, Jr., Hanes Walton, Jr., and Sherman C. Puckett, pg. 222-223
- ↑ "1880 Presidential General Election Data - National". Retrieved May 7, 2013. This link states the following, but doesn't identify even one source: "Below is a list of source from each state from which the 1880 Presidential Election popular vote data was collected"
- ↑ American Tariff League (May 30, 1919). The Tariff review, Volumes 63-64. p. 344. Retrieved May 23, 2010.