Significant wave height
In physical oceanography, the significant wave height (SWH or Hs) is defined traditionally as the mean wave height (trough to crest) of the highest third of the waves (H1/3). Nowadays it is usually defined as four times the standard deviation of the surface elevation – or equivalently as four times the square root of the zeroth-order moment (area) of the wave spectrum.[1] The symbol Hm0 is usually used for that latter definition. The significant wave height may thus refer to Hm0 or H1/3; the difference in magnitude between the two definitions is only a few percent.
Origin and definition
The original definition resulted from work by the oceanographer Walter Munk during World War II.[2][3] The significant wave height was intended to mathematically express the height estimated by a "trained observer". It is commonly used as a measure of the height of ocean waves.
Statistical distribution of the heights of individual waves
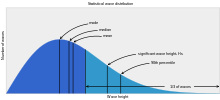
Significant wave height, scientifically represented as Hs or Hsig, is an important parameter for the statistical distribution of ocean waves. The most common waves are less in height than Hs. This implies that encountering the significant wave is not too frequent. However, statistically, it is possible to encounter a wave that is much higher than the significant wave.
Generally, the statistical distribution of the individual wave heights is well approximated by a Rayleigh distribution.[4] For example, given that Hs is 10 metres (33 feet), statistically:
- 1 in 10 will be larger than 10.7 metres (35 ft)
- 1 in 100 will be larger than 15.1 metres (50 ft)
- 1 in 1000 will be larger than 18.6 metres (61 ft)
This implies that one might encounter a wave that is roughly double the significant wave height. However, in rapidly changing conditions, the disparity between the significant wave height and the largest individual waves might be even larger.
Other statistics
Other statistical measures of the wave height are also widely used. The RMS wave height, which is defined as square root of the average of the squares of all wave heights, is approximately equal to Hs divided by 1.4.[1][5]
For example, according to the Irish Marine Institute:[6]
- "… at midnight on 9/12/2007 a record significant wave height was recorded of 17.2m at with a period of 14 seconds."
Measurement
Although most measuring devices estimate the significant wave height from a wave spectrum, satellite radar altimeters are unique in measuring directly the significant wave height thanks to the different time of return from wave crests and troughs within the area illuminated by the radar. The maximum ever measured wave height from a satellite is 20.1m during a North Atlantic storm in 2011.[7]
Weather forecasts
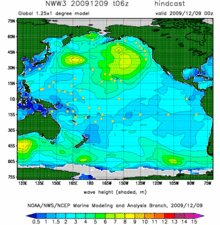
The World Meteorological Organization stipulates that certain countries are responsible for providing weather forecasts for the world's oceans. These respective countries' meteorological offices are called Regional Specialized Meteorological Centers, or RSMCs. In their weather products, they give ocean wave height forecasts in significant wave height. In the United States, NOAA's National Weather Service is the RSMC for a portion of the North Atlantic, and a portion of the North Pacific. The Ocean Prediction Center and the Tropical Prediction Center's Tropical Analysis and Forecast Branch (TAFB) issue these forecasts.
RSMCs use wind-wave models as tools to help predict the sea conditions. In the U.S., NOAA's WAVEWATCH III(R) model is used heavily.
Generalization to wave systems
A significant wave height is also defined similarly, from the wave spectrum, for the different systems that make up the sea. We then have a significant wave height for the wind-sea or for a particular swell.
See also
- Ocean Prediction Center
- Rogue wave: a wave of over twice the significant wave height
- Sea state
Notes
- 1 2 Holthuijsen, Leo H. (2007). Waves in Oceanic And Coastal Waters. Cambridge University Press. p. 70. ISBN 978-0-521-86028-4.
- ↑ Denny, M.W. (1988). Biology and the Mechanics of Wave-swept Shores. Princeton, New Jersey: Princeton University Press. ISBN 0-691-08487-4.
- ↑ Munk, W.H. (1944). Proposed uniform procedure for observing waves and interpreting instrument records. La Jolla, California: Wave Project at the Scripps Institute of Oceanography.
- ↑ Tayfun, Aziz (1980). "Narrow-band nonlinear sea waves". Journal of Geophysical Research. 85 (C3): "1543–1552". Bibcode:1980JGR....85.1548T. doi:10.1029/jc085ic03p01548.
- ↑ Dean, Robert G.; Dalrymple, Robert A. (1991). Water Wave Mechanics for Engineers and Scientists. World Scientific. p. 193. ISBN 978-981-02-0421-1.
- ↑ "Report on Weather Buoy Readings During December Storm — 6th to 11th December". Irish Marine Institute. Retrieved 2013-02-07.
- ↑ J. Hanafin, Y. Quilfen, F. Ardhuin, D. Vandemark, B. Chapron,H. Feng, J. Sienkiewicz, P. Queffeulou, M. Obrebski, B. Chapron, N. Reul, F. Collard, D. Cormand, E. B. de Azevedo, D. Vandemark,and E. Stutzmann (2012). Phenomenal sea states and swell radiation: a comprehensive analysis of the 12-16 February 2011 North Atlantic storms? Bull. Amer. Meterol. Soc., Vol. 93, pp. 1825–1832
External links
- NOAA WAVEWATCH III(R)
- NWS Environmental Modeling Center
- Envirtech solid state payload for directional waves measurement