Coordinates: 51°44′24″N 0°20′13″W / 51.740°N 0.337°W / 51.740; -0.337
St Albans is a constituency[n 1] represented in the House of Commons of the UK Parliament since 2005 by Anne Main, a Conservative.[n 2]
This article also describes the parliamentary borough (1554-1852) of the same name, consisting only of the city of St Albans, which elected two MPs by the bloc vote system.
Boundaries
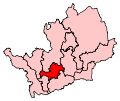
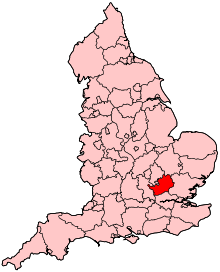
The seat is in Hertfordshire, England. Specifically, it comprises the cathedral city of St Albans and some of the surrounding countryside, mainly to the south of the city.
1885–1918
When the constituency was created in 1885 as the Mid or St Albans Division of Hertfordshire, it included the historic city as well as High Barnet (an area now in Greater London), Borehamwood, Elstree, Welwyn, Wheathampstead, and Harpenden.
It was defined as comprising:[2]
- The Municipal Borough of St. Albans,
- The Sessional Divisions of Barnet and St. Albans,
- Parts of the Sessional Divisions of Hertford (3 parishes) and Watford (1 parish)
- Part of the Sessional Division of Dacorum (4 entire parishes and those parts of 3 parishes that were in Hertfordshire)
The constituency contained the following civil parishes:[3]
- Aldenham, Bishop's Hatfield, Part of Caddington (remainder of parish was in Bedfordshire), Chipping Barnet, East Barnet, Elstree, Essendon, Flamstead, Great Gaddesden, Harpenden, Kensworth, Little Gaddesden, North Mimms, Redbourn, Ridge, St Albans: St Albans, St Albans: St Michael, St Albans: St Peter, St Stephen, Sandridge, Shenley, Part of South Mimms (the remainder of the parish was in Middlesex), part of Studham (the remainder of the parish was in Bedfordshire), Totteridge, Wheathampstead and part of Whipsnade (the reminder of the parish was in Bedfordshire).
1918–1945
The next redrawing of parliamentary constituencies was carried out prior to the 1918 general election. The Representation of the People Act 1918 redefined constituencies in terms of the urban and Rural districts created by the Local Government Act 1894. The St Albans Division of Hertfordshire was defined as comprising:[3][4]
1945–1950
The House of Commons (Redistribution of Seats) Act 1944 allowed for the creation of new constituencies in areas where there had been a large increase in population, with the new boundaries coming into force at the next election, which was held 1945. The number of constituencies in Hertfordshire was increased from five to six. The St Albans seat, which had an electorate of over 100,000, was effectively divided into two: a new Barnet Division was formed comprising East Barnet and Barnet Urban Districts and Elstree Rural District (the former Barnet Rural District had been renamed in 1941). At the 1945 general election the St Albans Division comprised:[3][5]
1950–1955
The Representation of the People Act 1948 provided for a complete redistribution of parliamentary seats, replacing those that had been created on a piecemeal basis in 1945. The Act also replaced the term "division" with "county constituency". The seats were first used at the 1950 general election and the revised St Albans County Constituency was defined as:[6]
- The borough of St. Albans
- the urban district of Welwyn Garden City;
- the rural district of Welwyn and the rural district of St. Albans except the parishes of Harpenden Rural and Redbourn.
1955–1974
The Welwyn Garden City area was transferred to the Hertford seat. The constituency was now defined as consisting of the Municipal Borough of St Albans, and in the Rural District of St Albans the civil parishes of Colney Heath, London Colney, St Michael Rural, St Stephen, Sandridge Rural, and Wheathampstead.
1974–1983
Under legislation passed in 1949 and 1958 there were regular periodic reviews of parliamentary constituencies. An order redrawing boundaries was made in 1970 reflecting the creation of Greater London and the London Borough of Barnet in 1965, which had changed the boundaries of Hertfordshire. The redefined seat, which was first contested at the February 1974 general election, was as follows:[3][7]
- The Borough of St. Albans
- The Urban District of Harpenden
- Five parishes in the rural district of St. Albans, namely, Harpenden Rural, Redbourn, St Michael Rural, Sandridge and Wheathampstead
1983–1997
Although local government was completely reorganised in April 1974, parliamentary boundaries were not changed until 1983. The constituencies created in 1983 were defined in terms of the non-metropolitan districts and their electoral wards introduced in 1974.
The local government legislation had created an enlarged City of St Albans including the old borough, most of the surrounding rural district and Harpenden Urban District.
The new St Albans County Constituency comprised 16 wards of the enlarged city: Ashley, Batchwood, Clarence, Colney Heath, Cunningham, Harpenden East, Harpenden North, Harpenden South, Harpenden West, Marshalswick North, Marshalswick South, Redbourn, St. Peters, Sandridge, Sopwell and Verulam.[8]
The constituency was not coterminous with the local government district: St Albans wards also formed parts of the new neighbouring constituencies of Hertsmere, Watford and Welwyn Hatfield.
1997–2010
The next periodic review was completed in 1995, and took effect at the 1997 general election. Hertfordshire's parliamentary representation was increased from 10 to 11 seats. The St Albans County Constituency was redrawn, with areas passing to a new Hitchin and Harpenden constituency, other areas added from the neighbouring South West Hertfordshire seat and boundary changes to the wards of the city. The seat was defined as comprising:[9]
- The following wards of the City of St. Albans, namely, Ashley, Batchwood, Clarence, Colney Heath, Cunningham, London Colney, Marshalswick North, Marshalswick South, Park Street, St. Peter's, St. Stephen's, Sopwell and Verulam; and
- The Bedmond ward of the District of Three Rivers.
2010–date
Constituencies were next redrawn in 2007, with the new boundaries taking effect at the 2010 general election. The Boundary Commission for England decided to retain the existing 11 seats in Hertfordshire, making relatively minor adjustments to bring the parliamentary boundaries in line with those of local government wards, which had changed since the 1995 review.[10]
The seat now comprises the following electoral wards:[11]
- Ashley, Batchwood, Clarence, Colney Heath, Cunningham, London Colney, Marshalswick North, Marshalswick South, Park Street, St Peter's, St Stephen, Sopwell, and Verulam in the City of St Albans
- Bedmond and Primrose Hill in the Three Rivers District.
History
The constituency elected a borough representative for over 300 years, until it was disenfranchised as a result of electoral corruption in 1852.[12] The constituency was re-established in an enlarged form in 1885 with an alternative pseudonym, the Mid Division of Hertfordshire. Both names were used in the Redistribution of Seats Act, which dovetailed with the Third Reform Act.
1885 to date
- Political history
The constituency was until 1997 held by a Conservative with the exception of five years of the Attlee ministry and early 20th century opposition of Henry Campbell-Bannerman and the first part of his premiership which was when he was in a minority.
Following boundary changes in 1997, and the founding of the New Labour movement which sought public sector reform and investment with expansion based on economic growth, the seat stood the possibility of, on the expected national swing led by Tony Blair, a win by a Labour politician, which took place when it was won for the party for the first time since the 1945 election.
- Prominent members
The noble and local landowning Grimston family have produced nine members throughout the seat's history. The three first heirs to the Earldom of Verulam have won election in the seat - the latest MP from the family was John Grimston who later became the 6th Earl.
Sir Hildred Carlile was a textiles entrepreneur and generous benefactor of Bedford College, University of London.
Francis Fremantle was chairman of the Parliamentary Medical Committee from 1923 to 1943.
Peter Lilley was a frontbench minister in government from 1992 until 1997, the Secretary of State for Social Security, after two years as Secretary of State for Trade and Industry.
Constituency profile
Workless claimants (registered jobseekers) were in November 2012 significantly lower than the national average of 3.8%, at 1.9% of the population based on a statistical compilation by The Guardian.[13]
Members of Parliament
MPs 1553–1640
MPs 1640–1852
MPs since 1885
Elections
Elections in the 2010s
Elections in the 2000s
Elections in the 1990s
Elections in the 1980s
Elections in the 1970s
Elections in the 1960s
Elections in the 1950s
Elections in the 1940s
Elections in the 1930s
Elections in the 1920s
Elections in the 1910s

Fremantle
- endorsed by Coalition Government
- endorsed by Coalition Government

Phillimore
Elections in the 1990s
Elections in the 1890s

Gibbs
Elections in the 1880s
See also
Notes and references
- Notes
- References
- ↑ "Electorate Figures - Boundary Commission for England". 2011 Electorate Figures. Boundary Commission for England. 4 March 2011. Retrieved 13 March 2011.
- ↑ Redistribution of Seats Act 1885, Schedule 7: Counties at Large. Number of Members and Names and Contents of Divisions.
- 1 2 3 4 Youngs, Frederic A, Jr. (1979). Guide to the Local Administrative Units of England, Vol.I: Southern England. London: Royal Historical Society. pp. 735–736. ISBN 0901050679.
- ↑ Representation of the People Act 1918, Schedule 9: Redistribution of Seats
- ↑ "New Electoral Divisions. Proposed Areas In Greater London, Harrow And Hendon Split". The Times. 11 January 1945. p. 2.
- ↑ Representation of the People Act 1948, Schedule 1: Parliamentary Constituencies
- ↑ The Parliamentary Constituencies (England) Order 1970 (S.I. 1970/1674)
- ↑ The Parliamentary Constituencies (England) Order 1983 (S.I. 1983/417)
- ↑ "The Parliamentary Constituencies (England) Order 1995 (S.I.1955/1626)". legislation.gov.uk. The National Archives. Retrieved 21 August 2013.
- ↑ "Fifth Periodical Report, Volume 1" (PDF). Boundary Commission for England. 2007. p. 335. Retrieved 21 August 2013.
- ↑ "The Parliamentary Constituencies (England) Order 2007 (S.I. 2007/1681)". legislation.gov.uk. The National Archives. Retrieved 21 August 2013.
- ↑ Reform Act 1867
- ↑ Unemployment claimants by constituency The Guardian
- 1 2 3 4 5 "History of Parliament". Retrieved 2011-10-02.
- 1 2 3 4 5 6 7 8 9 10 "History of Parliament". Retrieved 2011-10-02.
- ↑
 "Wroth, Robert". Dictionary of National Biography. London: Smith, Elder & Co. 1885–1900.
 - ↑ Admiral from 1702
- ↑ Created The Viscount Grimston (in the Peerage of Ireland), November 1719
- ↑ On petition (in a dispute over the franchise), Hale was found not to have been duly elected
- ↑ The 2nd Viscount Grimston (in the Peerage of Ireland) from October 1756
- ↑ Richard Sutton was created a baronet, 1772
- ↑ Styled Lord Bingham from October 1795, when his father was raised to an Earldom
- ↑ Leigh Rayment's Historical List of MPs – Constituencies beginning with "S" (part 1)
- 1 2 3 4 5 6 7 8 9 10 Craig, F. W. S. (1989) [1974]. British parliamentary election results 1885–1918 (2nd ed.). Chichester: Parliamentary Research Services. p. 297. ISBN 0-900178-27-2.
- 1 2 3 4 5 6 7 8 9 10 11 Craig, F. W. S. (1983) [1969]. British parliamentary election results 1918–1949 (3rd ed.). Chichester: Parliamentary Research Services. p. 375. ISBN 0-900178-06-X.
- ↑ New M.P. For St. Albans, The Times, October 06, 1943
- ↑ "Election Data 2015". Electoral Calculus. Archived from the original on 17 October 2015. Retrieved 17 October 2015.
- ↑ "2015 Parliamentary Election Results". St Albans City and District Council. 8 May 2015. Retrieved 8 May 2015.
- ↑ "Election Data 2010". Electoral Calculus. Archived from the original on 17 October 2015. Retrieved 17 October 2015.
- ↑ City & District of St Albans - Statement of persons nominated
- ↑ "UK General Election results May 2010". Richard Kimber's Political Science Resources. Retrieved 4 February 2011.
- ↑ "Election Data 2005". Electoral Calculus. Archived from the original on 15 October 2011. Retrieved 18 October 2015.
- ↑ "UK General Election results May 2005". Richard Kimber's Political Science Resources. Retrieved 4 February 2011.
- ↑ "Election Data 2001". Electoral Calculus. Archived from the original on 15 October 2011. Retrieved 18 October 2015.
- ↑ "General Election result, June 2001". Richard Kimber's Political Science Resources. Retrieved 4 February 2011.
- ↑ "Election Data 1997". Electoral Calculus. Archived from the original on 15 October 2011. Retrieved 18 October 2015.
- ↑ "General Election result, May 1997". Richard Kimber's Political Science Resources. Retrieved 4 February 2011.
- ↑ "Election Data 1992". Electoral Calculus. Archived from the original on 15 October 2011. Retrieved 18 October 2015.
- ↑ "UK General Election results April 1992". Richard Kimber's Political Science Resources. Retrieved 4 February 2011.
- ↑ "Election Data 1987". Electoral Calculus. Archived from the original on 15 October 2011. Retrieved 18 October 2015.
- ↑ "UK General Election results 1987". Richard Kimber's Political Science Resources. Retrieved 4 February 2011.
- ↑ "Election Data 1983". Electoral Calculus. Archived from the original on 15 October 2011. Retrieved 18 October 2015.
- ↑ "UK General Election results June 1983". Richard Kimber's Political Science Resources. Retrieved 4 February 2011.
- ↑ "UK General Election results May 1979". Richard Kimber's Political Science Resources. Retrieved 4 February 2011.
- 1 2 3 "'St Albans', Feb 1974 - May 1983". ElectionWeb Project. Cognitive Computing Limited. Retrieved 4 April 2016.
- ↑ "UK General Election results October 1974". Richard Kimber's Political Science Resources. Retrieved 4 February 2011.
- ↑ "UK General Election results February 1974". Richard Kimber's Political Science Resources. Retrieved 4 February 2011.
- ↑ "UK General Election results June 1970". Richard Kimber's Political Science Resources. Retrieved 4 February 2011.
- ↑ "UK General Election results March 1966". Richard Kimber's Political Science Resources. Retrieved 4 February 2011.
- ↑ "UK General Election results October 1964". Richard Kimber's Political Science Resources. Retrieved 4 February 2011.
- ↑ "UK General Election results October 1959". Richard Kimber's Political Science Resources. Retrieved 4 February 2011.
- ↑ "UK General Election results May 1955". Richard Kimber's Political Science Resources. Retrieved 4 February 2011.
- ↑ "UK General Election results October 1951". Richard Kimber's Political Science Resources. Retrieved 4 February 2011.
- ↑ "UK General Election results February 1950". Richard Kimber's Political Science Resources. Retrieved 4 February 2011.
- ↑ For the 1945 general election, changes are calculated relative to the 1935 general election results, not the uncontested by-election in 1943
- ↑ Large Labour Vote At St. Albans, Seat Held By Coalition, The Times, Wednesday 24 December 1919, page 10
Sources
- Robert Beatson, A Chronological Register of Both Houses of Parliament (London: Longman, Hurst, Res & Orme, 1807)
- D Brunton & D H Pennington, Members of the Long Parliament (London: George Allen & Unwin, 1954)
- Cobbett's Parliamentary history of England, from the Norman Conquest in 1066 to the year 1803 (London: Thomas Hansard, 1808)
- F W S Craig, British Parliamentary Election Results 1832-1885 (2nd edition, Aldershot: Parliamentary Research Services, 1989)
- Henry Stooks Smith, The Parliaments of England from 1715 to 1847 (2nd edition, edited by FWS Craig - Chichester: Parliamentary Reference Publications, 1973)
- Leigh Rayment's Historical List of MPs – Constituencies beginning with "S" (part 1)
External links