WaterGAP
The global freshwater model WaterGAP calculates flows and storages of water on all continents of the globe (except Antarctica), taking into account the human influence on the natural freshwater system by water abstractions and dams. It supports understanding the freshwater situation across the world’s river basins during the 20th and the 21st century, and is applied to assess water scarcity, droughts and floods and to quantify the impact of human actions on freshwater. Modelling results of WaterGAP have contributed to international assessment of the global environmental situation including the UN World Water Development Reports, the Millennium Ecosystem Assessment, the UN Global Environmental Outlooks as well as to reports of the Intergovernmental Panel on Climate Change. They were included in the 2012 Environmental Performance Index which ranks countries according to their environmental performance (index for impact of human water use on ecosystems).[1]
WaterGAP (Water Global Assessment and Prognosis)[2] has been developed at the University of Kassel (Germany) since 1996, and since 2003 also at the University of Frankfurt (Germany). It consists of both the WaterGAP Global Hydrology Model (WGHM)[3][4][5] and five water use models for the sectors irrigation,[6] livestock, households,[7] manufacturing and cooling of thermal power plants.[8][9] An additional model component computes the fractions of total water use that are abstracted from either groundwater or surface waters (rivers, lakes and reservoirs).[10] All computations are done with a temporal resolution of 1 day and a spatial resolution of 0.5° geographical latitude × 0.5° geographical longitude, which is equivalent to 55 km × 55 km at the equator. Model input includes time series of climate data (e.g. precipitation, temperature and solar radiation) and physiogeographic information like characteristics of surface water bodies (lakes, reservoirs and wetlands), land cover, soil type, topography and irrigated area.
WaterGAP Global Hydrology Model WGHM
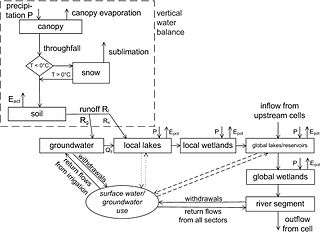
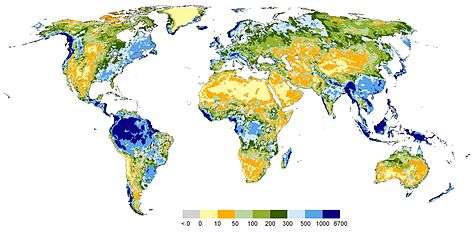
WGHM computes time-series of fast-surface and subsurface runoff, groundwater recharge and river discharge as well as storage variations of water in canopy, snow, soil, groundwater, lakes, wetlands and rivers. Thus it quantifies the total renewable water resources as well as the renewable groundwater resources of a grid cell, river basin, or country. Precipitation on each grid cells is modelled as being transported through the different storage compartments and partly evapotranspirating. Location and size of lakes, reservoirs and wetlands are defined by the global lakes and wetland database (GLWD),[11] with a recent addition of more than 6000 man-made reservoirs.[12][13] Groundwater storage is affected by diffuse groundwater recharge, which is modeled as a function of total runoff, relief, soil texture, hydrogeology and the existence of permafrost or glaciers.[5] To allow a plausible representation of the actual freshwater situation, version 2.2 of WGHM is tuned against measured long-term average annual river discharge at 1323 gauging stations. The performance of WGHM has been compared to that of other global hydrological models for both Europe[14][15] and the globe.[16]
Water Use Models
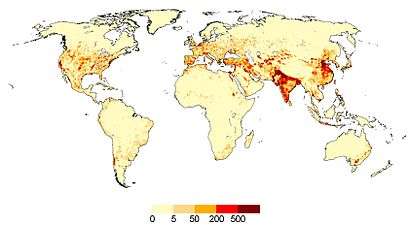
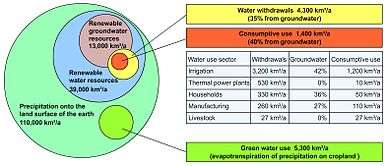
Modeling of water use refers to computation of water withdrawals and consumptive water uses (the fraction of the abstracted water that evapotranspires during use) in each grid cell. Consumptive irrigation water use is computed by the Global Irrigation Model as a function of irrigated area[17] (See an interactive version of the Global Map of Irrigation Areas on the FAO website.) and climate in each grid cell. Water abstractions for irrigation are calculated by dividing consumptive use by a country-specific irrigation water use efficiency.[6] Livestock water use is calculated as a function of the animal numbers and water requirements of different livestock types. Grid cell values of domestic and manufacturing water use are based on national values that are downscaled to the grid cells using population density. Cooling water use takes into account the location of more than 60,000 power plants, their cooling type and their electricity production.[9] Temporal development of household water use is modeled as a function of technological and structural change (the latter as a function of gross domestic product), taking into account population change.[7] The temporal development of manufacturing and thermal power water use is modeled also as a function of structural and technological change, with national manufacturing output (for manufacturing water use) and national electricity output (for thermal power plant use) as the drivers of water use.[8] Time series of monthly values of irrigation water use are computed, while all other uses are assumed to be constant throughout the year and to only vary from year to year. Based on sectoral water withdrawals and consumptive use as computed by the five water use models, the model component GWSWUSE calculates the total net abstraction from groundwater and from surface water in each grid cell.[10]

Applications
WaterGAP has been applied to assess which areas of the world are and will be affected by water scarcity, and to estimate the world’s freshwater balance. In several studies, WaterGAP has served to estimate the impact of climate change on the global freshwater system.[18][19][20] In addition, the alteration of ecologically relevant river flow characteristics due to human water use and dams was studied.[12] WaterGAP has been applied to interpret GRACE (Gravity Recovery and Climate Experiment) satellite measurement of the dynamic gravity of the Earth, as for the continents, the seasonal and longer-term gravity changes are to a large extent caused by changes of the water stored in groundwater, surface waters, soil and snow.[21] WaterGAP results were used in life-cycle assessments to take into account the impact of water abstractions on health.[22]

References
- ↑ Emerson, J.W., A. Hsu, M.A. Levy, A. de Sherbinin, V. Mara, D.C. Esty, and M. Jaiteh. 2012: 2012 Environmental Performance Index and Pilot Trend Environmental Performance Index. New Haven: Yale Center for Environmental Law and Policy.
- ↑ Alcamo, J., Döll, P., Henrichs, T., Kaspar, F., Lehner, B., Rösch, T., Siebert, S. (2003): Development and testing of the WaterGAP 2 global model of water use and availability. Hydrological Sciences Journal, 48(3), 317-338.
- ↑ Döll, P., Kaspar, F., Lehner, B. (2003): A global hydrological model for deriving water availability indicators: model tuning and validation. Journal of Hydrology, 270 (1-2), 105-134.
- ↑ Hunger, M., Döll, P. (2008): Value of river discharge data for global-scale hydrological modeling. Hydrol. Earth Syst. Sci., 12, 841-861.
- 1 2 3 Döll, P., Fiedler, K. (2008): Global-scale modeling of groundwater recharge. Hydrol. Earth Syst. Sci., 12, 863-885.
- 1 2 Döll, P., Siebert, S. (2002): Global modeling of irrigation water requirements. Water Resources Research, 38(4), 8.1-8.10, DOI 10.1029/2001WR000355.
- 1 2 Voß, F., Flörke, M. Alcamo, J. (2009): Preliminary Spatially Explicit Estimates of Past and Present Domestic Water Use. WATCH Technical Report 17, Kassel, 16 pp.
- 1 2 Voß, F., Flörke, M. (2010): Spatially Explicit Estimates of Past and Present Manu-facturing and Energy Water Use. WATCH Technical Report 23, Kassel, 17 pp.
- 1 2 Vassolo, S., Döll, P. (2005): Global-scale gridded estimates of thermoelectric power and manufacturing water use. Water Resources Research, 41(4) W04010, doi.org/10.1029/2004WR003360.
- 1 2 3 4 Döll, P., Hoffmann-Dobrev, H., Portmann, F.T., Siebert, S., Eicker, A., Rodell, M., Strassberg, G., Scanlon, B. (2012): Impact of water withdrawals from groundwater and surface water on continental water storage variations. J. Geodyn. 59-60, 143-156, doi:10.1016/j.jog.2011.05.001.
- ↑ Lehner, B., Döll, P. (2004): Development and validation of a database of lakes, reservoirs and wetlands. Journal of Hydrology, 296 (1-4), 1-22.
- 1 2 3 Döll, P., Fiedler, K., Zhang, J. (2009): Global-scale analysis of river flow alterations due to water withdrawals and reservoirs. Hydrol. Earth Syst. Sci., 13, 2413-2432.
- ↑ Lehner, B., Reidy Liermann, C., Revenga, C., Vörösmary, C., Fekete, B., Crouzet, P., Döll, P., Endejan, M., Frenken, K., Magome, J., Nilsson, C., Robertson, J.C., Rödel, R., Sindorf, N., Wisser, D. (2011): High resolution mapping of the world’s reservoirs and dams for sustainable river flow management. Frontiers in Ecology and the Environment, 9(9), 494-502.
- ↑ Gudmundsson, L., T. Wagener, L. M. Tallaksen, and K. Engeland (2012), Evaluation of nine large-scale hydrological models with respect to the seasonal runoff climatology in Europe, Water Resour. Res., 48, W11504, doi:10.1029/2011WR010911.
- ↑ Gudmundsson, L., et al. (2012), Comparing large-scale hydrological model simulations to observed runoff percentiles in Europe, J. Hydrometeorol., 13(2), 604–620, doi:10.1175/JHM-D-11-083.1.
- ↑ Haddeland, I., et al. (2011), Multimodel estimate of the global terrestrial water balance: Setup and first results, J. Hydrometeorol., 12(5), 869– 884, doi:10.1175/2011JHM1324.1.
- ↑ Siebert, S., Döll, P., Hoogeveen, J., Faures, J.-M., Frenken, K., Feick, S. (2005): Development and validation of the global map of irrigation areas. Hydrology and Earth System Sciences, 9, 535-547.
- ↑ Döll, P. (2009): Vulnerability to the impact of climate change on renewable groundwater resources: a global-scale assessment. Environ. Res. Lett., 4, 036006 (12pp). doi: 10.1088/1748-9326/4/3/035006
- ↑ Döll, P., Zhang, J. (2010): Impact of climate change on freshwater ecosystems: a global-scale analysis of ecologically relevant river flow alterations. Hydrol. Earth Syst. Sci., 14, 783-799.
- ↑ Döll, P., Müller Schmied, H. (2012): How is the impact of climate change on river flow regimes related to the impact on mean annual runoff? A global-scale analysis. Environ. Res. Lett., 7 (1), 014037 (11 pp). doi:10.1088/1748-9326/7/1/014037
- ↑ Schmidt, R., Schwintzer, P., Flechtner, F., Reigber, Ch., Güntner, A., Döll, P., Ramillien, G., Cazenave, A., Petrovic, S., Jochmann, H., Wünsch, J. (2006): GRACE observations of changes in continental water storage. Global and Planetary Change, 50, 112-126.
- ↑ Boulay, A.-M., Bulle,C., Bayart, J.-B., Deschênes,L., Margni, M. (2011): Regional Characterization of Freshwater Use in LCA: Modeling Direct Impacts on Human Health. Environmental Science & Technology, 45 (20), 8948-8957.