Birmingham Northfield (UK Parliament constituency)
Coordinates: 52°24′N 1°59′W / 52.40°N 1.98°W
| Birmingham, Northfield | |
|---|---|
|
Borough constituency for the House of Commons | |
|
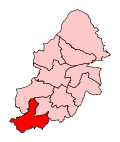
Boundary of Birmingham, Northfield in Birmingham. | |
|
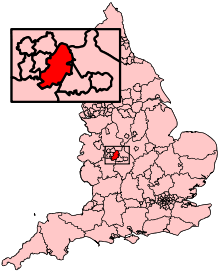
Location of Birmingham within England. | |
| County | West Midlands |
| Population | 101,422 (2011 census)[1] |
| Electorate | 72,190 (December 2010)[2] |
| Current constituency | |
| Created | 1950 |
| Member of parliament | Richard Burden (Labour) |
| Number of members | One |
| Overlaps | |
| European Parliament constituency | West Midlands |
Birmingham, Northfield is a constituency[n 1] of part of the city of Birmingham represented in the House of Commons of the UK Parliament since 1992 by Richard Burden of the Labour Party.[n 2]
Constituency profile
Among the areas largest features are the closed MG Rover Group factory that long formed a major employer in the constituency and officially closed in the run up to the 2005 general election, a large hospital and the North Worcestershire Golf Course.[3] The Labour MP Richard Burden was nonetheless returned, albeit with a majority reduced by 5.6%. He was re-elected, with a majority reduced by 14.1%,[n 3] in 2010. Shortly after the 2010 election, Liberal Democrat candidate Mike Dixon was jailed for clubbing a family cat to death with a walking stick.[4]
History
Since creation in 1950, Labour Party MPs have served the ward with the exception of the period from 1979 to 1992 while the Conservative Party were in government, with a one-year gap caused by a Labour win in a by-election, in 1982. From 1979 to 1982 the MP was a member of the influential and large Cadbury family, Jocelyn Cadbury.
Boundaries
1950-1974: The County Borough of Birmingham wards of King's Norton, Northfield, and Weoley.
1974-1983: The County Borough of Birmingham wards of Longbridge, Northfield, and Weoley.
1983-1997: The City of Birmingham wards of Bartley Green, Longbridge, Northfield, and Weoley.
1997-2010: The City of Birmingham wards of Longbridge, Northfield, and Weoley.
2010–present: The City of Birmingham wards of King's Norton, Longbridge, Northfield, and Weoley.
Following the review of parliamentary representation in Birmingham and the West Midlands,[5] the Boundary Commission for England created a modified Northfield seat which gained the ward of Kings Norton (previously in the Selly Oak constituency).
Members of Parliament
Elections
Elections in the 2010s
| Party | Candidate | Votes | % | ± | |
|---|---|---|---|---|---|
| Labour | Richard Burden | 17,673 | 41.6 | +1.3 | |
| Conservative | Rachel Maclean | 15,164 | 35.7 | +2.1 | |
| UKIP | Keith Rowe | 7,106 | 16.7 | +13.5 | |
| Liberal Democrat | Steve Haynes | 1,349 | 3.2 | −12.5 | |
| Green | Anna Masters[8] | 1,169 | 2.8 | +1.8 | |
| Majority | 2,509 | 5.9 | |||
| Turnout | 42,461 | 59.4 | |||
| Labour hold | Swing | -0.8 | |||
Going into the 2015 general election, this was the 121st most marginal constituency in Great Britain, the Conservatives requiring a swing from Labour of 3.3% to take the seat (based on the result of the 2010 general election).[9]
| Party | Candidate | Votes | % | ± | |
|---|---|---|---|---|---|
| Labour | Richard Burden | 16,841 | 40.3 | −10.1 | |
| Conservative | Keely Huxtable | 14,059 | 33.6 | +3.2 | |
| Liberal Democrat | Mike Dixon | 6,550 | 15.7 | +3.3 | |
| BNP | Les Orton | 2,290 | 5.5 | +2.2 | |
| UKIP | John Borthwick | 1,363 | 3.3 | +1.0 | |
| Green | Susan Pearce | 406 | 1.0 | N/A | |
| Common Good | Dick Rodgers | 305 | 0.7 | −0.4 | |
| Majority | 2,782 | 6.7 | |||
| Turnout | 41,814 | 58.6 | +3.4 | ||
| Labour hold | Swing | −6.6 | |||
Elections in the 2000s
| Party | Candidate | Votes | % | ± | |
|---|---|---|---|---|---|
| Labour | Richard Burden | 15,419 | 49.6 | −6.4 | |
| Conservative | Vicky Ford | 8,965 | 28.9 | −0.7 | |
| Liberal Democrat | Trevor Sword | 4,171 | 13.4 | +2.2 | |
| BNP | Mark Cattell | 1,278 | 4.1 | N/A | |
| UKIP | Gillian Chant | 641 | 2.1 | +0.2 | |
| Common Good | Richard Rogers | 428 | 1.4 | N/A | |
| Socialist Alternative | Louise Houdley | 120 | 0.4 | N/A | |
| Workers Revolutionary | Frank Sweeney | 34 | 0.1 | N/A | |
| Majority | 6,454 | 20.8 | |||
| Turnout | 31,056 | 56.6 | +3.8 | ||
| Labour hold | Swing | −2.8 | |||
| Party | Candidate | Votes | % | ± | |
|---|---|---|---|---|---|
| Labour | Richard Burden | 16,528 | 56.0 | −1.5 | |
| Conservative | Nils Purser | 8,730 | 29.6 | +1.6 | |
| Liberal Democrat | Trevor Sword | 3,322 | 11.2 | +0.8 | |
| UKIP | Stephen Rogers | 550 | 1.9 | N/A | |
| Socialist Alliance | Clive Walder | 193 | 0.7 | N/A | |
| Socialist Labour | Zane Carpenter | 151 | 0.5 | N/A | |
| Communist | Andrew Chaffer | 60 | 0.2 | N/A | |
| Majority | 7,798 | 26.4 | |||
| Turnout | 29,534 | 52.8 | −15.5 | ||
| Labour hold | Swing | −1.5 | |||
Elections in the 1990s
| Party | Candidate | Votes | % | ± | |
|---|---|---|---|---|---|
| Labour | Richard Burden | 22,316 | 57.4 | +11.9 | |
| Conservative | Alan C. Blumenthal | 10,873 | 28.0 | −14.4 | |
| Liberal Democrat | Micheal R. Ashell | 4,078 | 10.5 | +0.4 | |
| Referendum | David Gent | 1,243 | 3.2 | N/A | |
| BNP | Keith A. Axon | 337 | 0.9 | N/A | |
| Majority | 11,443 | 29.5 | |||
| Turnout | 38,847 | 68.3 | −7.8 | ||
| Labour hold | Swing | +13.1 | |||
| Party | Candidate | Votes | % | ± | |
|---|---|---|---|---|---|
| Labour | Richard Burden | 24,443 | 45.5 | +6.3 | |
| Conservative | Roger Douglas King | 23,803 | 44.4 | −0.7 | |
| Liberal Democrat | David L. Cropp | 5,431 | 10.1 | −5.5 | |
| Majority | 630 | 1.1 | −4.8 | ||
| Turnout | 53,667 | 76.1 | +4.5 | ||
| Labour gain from Conservative | Swing | +3.5 | |||
Election in the 1980s
| Party | Candidate | Votes | % | ± | |
|---|---|---|---|---|---|
| Conservative | Roger Douglas King | 24,024 | 45.1 | +2.4 | |
| Labour | John Spellar | 20,889 | 39.2 | +1.7 | |
| Social Democratic | John Christopher Gordon | 8,319 | 15.6 | −3.6 | |
| Majority | 3,135 | 5.9 | |||
| Turnout | 53,232 | 72.6 | |||
| Conservative hold | Swing | +2.0 | |||
| Party | Candidate | Votes | % | ± | |
|---|---|---|---|---|---|
| Conservative | Roger Douglas King | 22,596 | 42.7 | −2.7 | |
| Labour | John Spellar | 19,836 | 37.5 | −7.6 | |
| Liberal | David Webb | 10,045 | 19.0 | +10.8 | |
| Communist | Peter Raymond Sheppard | 420 | 0.8 | N/A | |
| Majority | 2,760 | 5.2 | |||
| Turnout | 52,897 | 71.2 | |||
| Conservative gain from Labour | Swing | +5.1 | |||
| Party | Candidate | Votes | % | ± | |
|---|---|---|---|---|---|
| Labour | John Spellar | 15,904 | 36.3 | −8.8 | |
| Conservative | Roger Gale | 15,615 | 35.6 | −9.8 | |
| Liberal | Stephen Ridley | 11,453 | 26.1 | +18.0 | |
| National Front | Ian Anderson | 411 | 0.9 | −0.2 | |
| Communist | Peter Sheppard | 349 | 0.8 | N/A | |
| People's Progressive Party | Ronald Taylor | 63 | 0.2 | N/A | |
| Democratic Monarchist, Public Safety, White Resident | Bill Boaks | 60 | 0.1 | N/A | |
| Majority | 289 | 0.7 | |||
| Turnout | 43,855 | 55.0 | |||
| Labour gain from Conservative | Swing | −0.5 | |||
Elections in the 1970s
| Party | Candidate | Votes | % | ± | |
|---|---|---|---|---|---|
| Conservative | Jocelyn Cadbury | 25,304 | 45.4 | +13.4 | |
| Labour | Raymond John Carter | 25,100 | 45.1 | −7.0 | |
| Liberal | R. Lewthwaite | 4,538 | 8.2 | −6.7 | |
| National Front | R. Newman | 614 | 1.1 | N/A | |
| Workers Revolutionary | J. Beale | 144 | 0.3 | N/A | |
| Majority | 204 | 0.4 | |||
| Turnout | 55,700 | 70.6 | +2.7 | ||
| Conservative gain from Labour | Swing | +10.2 | |||
| Party | Candidate | Votes | % | ± | |
|---|---|---|---|---|---|
| Labour | Raymond John Carter | 27,435 | 52.1 | −4.0 | |
| Conservative | Jocelyn Cadbury | 16,838 | 32.0 | −9.0 | |
| Liberal | D. Haines | 7,851 | 14.9 | N/A | |
| People | E. A. Davenport | 359 | 0.7 | N/A | |
| Communist | Derek Robinson | 180 | 0.3 | −0.4 | |
| Majority | 10,597 | 20.1 | |||
| Turnout | 52,663 | 67.9 | −5.6 | ||
| Labour hold | Swing | +2.5 | |||
| Party | Candidate | Votes | % | ± | |
|---|---|---|---|---|---|
| Labour | Raymond John Carter | 31,704 | 56.1 | +5.6 | |
| Conservative | John Butcher | 23,175 | 41.0 | −7.6 | |
| Independent | M. Newman | 1,237 | 2.2 | N/A | |
| Communist | Derek Robinson | 368 | 0.7 | −0.2 | |
| Majority | 8,529 | 15.1 | |||
| Turnout | 56,484 | 73.5 | |||
| Labour hold | Swing | +1.0 | |||
| Party | Candidate | Votes | % | ± | |
|---|---|---|---|---|---|
| Labour | Raymond John Carter | 33,364 | 50.5 | −8.2 | |
| Conservative | David W. Bell | 32,148 | 48.6 | +8.9 | |
| Communist | Derek Robinson | 605 | 0.9 | −0.7 | |
| Majority | 1,216 | 1.8 | |||
| Turnout | 66,117 | 68.3 | |||
| Labour hold | Swing | −8.6 | |||
Elections in the 1960s
| Party | Candidate | Votes | % | ± | |
|---|---|---|---|---|---|
| Labour | William Donald Chapman | 36,801 | 58.7 | +11.5 | |
| Conservative | Christopher Cromwell Chalker | 24,899 | 39.7 | −0.7 | |
| Communist | Derek Robinson | 1,029 | 1.6 | N/A | |
| Majority | 11,902 | 19.0 | |||
| Turnout | 62,729 | 75.1 | |||
| Labour hold | Swing | +6.1 | |||
| Party | Candidate | Votes | % | ± | |
|---|---|---|---|---|---|
| Labour | William Donald Chapman | 29,301 | 47.2 | −3.6 | |
| Conservative | Herbert Banner Adkins | 25,063 | 40.4 | −8.8 | |
| Liberal | Roy Lewthwaite | 7,682 | 12.4 | N/A | |
| Majority | 4,238 | 6.8 | |||
| Turnout | 62,046 | 77.2 | |||
| Labour hold | Swing | +2.6 | |||
Election in the 1950s
| Party | Candidate | Votes | % | ± | |
|---|---|---|---|---|---|
| Labour | William Donald Chapman | 29,587 | 50.8 | −2.0 | |
| Conservative | Reginald Edwin Eyre | 28,647 | 49.2 | +2.0 | |
| Majority | 940 | 1.6 | |||
| Turnout | 58,234 | 78.5 | |||
| Labour hold | Swing | −2.0 | |||
| Party | Candidate | Votes | % | ± | |
|---|---|---|---|---|---|
| Labour | William Donald Chapman | 27,072 | 52.8 | +0.0 | |
| Conservative | Clement Sweet | 24,188 | 47.2 | +0.0 | |
| Majority | 2,884 | 5.6 | |||
| Turnout | 51,260 | 78.6 | |||
| Labour hold | Swing | +0.0 | |||
| Party | Candidate | Votes | % | ± | |
|---|---|---|---|---|---|
| Labour | William Donald Chapman | 26,580 | 52.8 | −0.2 | |
| Conservative | Maurice Chandler | 23,730 | 47.2 | +7.6 | |
| Majority | 2,850 | 5.7 | |||
| Turnout | 50,310 | 83.4 | |||
| Labour hold | Swing | −3.9 | |||
| Party | Candidate | Votes | % | ± | |
|---|---|---|---|---|---|
| Labour | Albert Raymond Blackburn | 26,714 | 53.0 | N/A | |
| Conservative | Thomas Lascelles Isa Shandon Valiant Iremonger | 19,974 | 39.6 | N/A | |
| Liberal | Evan Laurence Frederick Richards | 3,280 | 6.5 | N/A | |
| Communist | Richard Albert Etheridge | 479 | 1.0 | N/A | |
| Majority | 6,740 | 13.4 | N/A | ||
| Turnout | 50,447 | 84.7 | N/A | ||
| Labour win (new seat) | |||||
See also
Notes and references
- Notes
- ↑ A borough constituency (for the purposes of election expenses and type of returning officer)
- ↑ As with all constituencies, the constituency elects one Member of Parliament (MP) by the first past the post system of election at least every five years.
- ↑ Which leaves the incumbent MP with a majority of 6.7%
- References
- ↑ "Birmingham, Northfield: Usual Resident Population, 2011". Neighbourhood Statistics. Office for National Statistics. Retrieved 30 January 2015.
- ↑ "Electorate Figures - Boundary Commission for England". 2011 Electorate Figures. Boundary Commission for England. 4 March 2011. Archived from the original on 6 November 2010. Retrieved 13 March 2011.
- ↑ Ordnance survey website
- ↑ http://www.birminghampost.net/news/west-midlands-news/2011/03/11/birmingham-liberal-democrat-election-candidate-jailed-for-killing-cat-65233-28320274/
- ↑ http://www.boundarycommissionforengland.org.uk/review_areas/West_Midlands_Boroughs/images/Birmingham_OM_RR.gif[]
- ↑ Leigh Rayment's Historical List of MPs – Constituencies beginning with "N" (part 3)
- ↑ "Election Data 2015". Electoral Calculus. Archived from the original on 17 October 2015. Retrieved 17 October 2015.
- ↑ "Archived copy". Archived from the original on 2015-04-02. Retrieved 2015-03-27.
- ↑ Ransome Mpini; Charlotte Thornton; John Walton; Marcelo Zanni (24 February 2014). "Election 2015: The political battleground". BBC News. Retrieved 29 January 2015.
- ↑ "Election Data 2010". Electoral Calculus. Archived from the original on 17 October 2015. Retrieved 17 October 2015.
- ↑ Statement of Persons Nominated and Notice of Poll 2010
- ↑ "Election Data 2005". Electoral Calculus. Archived from the original on 15 October 2011. Retrieved 18 October 2015.
- ↑ "Election Data 2001". Electoral Calculus. Archived from the original on 15 October 2011. Retrieved 18 October 2015.
- ↑ "Election Data 1997". Electoral Calculus. Archived from the original on 15 October 2011. Retrieved 18 October 2015.
- ↑ "Election Data 1992". Electoral Calculus. Archived from the original on 15 October 2011. Retrieved 18 October 2015.
- ↑ "Politics Resources". Election 1992. Politics Resources. 9 April 1992. Retrieved 2010-12-06.
- ↑ "Election Data 1987". Electoral Calculus. Archived from the original on 15 October 2011. Retrieved 18 October 2015.
- ↑ "Election Data 1983". Electoral Calculus. Archived from the original on 15 October 2011. Retrieved 18 October 2015.
![http://www.boundarycommissionforengland.org.uk/review_areas/West_Midlands_Boroughs/images/Birmingham_OM_RR.gif[]](http://www.boundarycommissionforengland.org.uk/review_areas/West_Midlands_Boroughs/images/Birmingham_OM_RR.gif[])