Coventry North West (UK Parliament constituency)
| Coventry North West | |
|---|---|
|
Borough constituency for the House of Commons | |
|
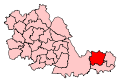
Boundary of Coventry North West in West Midlands. | |
|
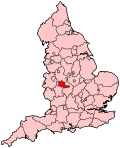
Location of West Midlands within England. | |
| County | West Midlands |
| Electorate | 74,180 (December 2010)[1] |
| Current constituency | |
| Created | 1974 |
| Member of parliament | Geoffrey Robinson (Labour) |
| Number of members | One |
| Created from | Coventry North, Coventry West |
| Overlaps | |
| European Parliament constituency | West Midlands |
Coventry North West is a constituency[n 1] in the city of Coventry represented in the House of Commons of the UK Parliament since 1976 by Geoffrey Robinson of the Labour Party.[n 2]
Boundaries
1974-1983: The County Borough of Coventry wards of Bablake, Holbrook, Radford, and Sherbourne.
1983-1997: The City of Coventry wards of Bablake, Holbrook, Radford, and Sherbourne.
1997-present: The City of Coventry wards of Bablake, Holbrook, Radford, Sherbourne, Whoberley, and Woodlands.
History
The area's electorate has roughly grown in line with national trends, leading to minimal boundary changes and has elected Labour MPs at every election since its first election in February 1974.
Members of Parliament
| Election | Member[2] | Party | Notes | |
|---|---|---|---|---|
| Feb 1974 | Maurice Edelman | Labour | Died 1975 | |
| 1976 by-election | Geoffrey Robinson | Labour | Paymaster General 1997-98 | |
Elections
Elections in the 2010s
| Party | Candidate | Votes | % | ± | |
|---|---|---|---|---|---|
| Labour | Geoffrey Robinson | 18,557 | 41.0 | -1.8 | |
| Conservative | Parvez Akhtar | 14,048 | 31.0 | +1.7 | |
| UKIP | Harjinder Sehmi | 7,101 | 15.7 | +12.9 | |
| Green | Laura Vesty[5] | 1,961 | 4.3 | +3.3 | |
| Liberal Democrat | Andrew Furse | 1,810 | 4.0 | -13.9 | |
| TUSC | Dave Nellist | 1,769 | 3.9 | +3.9 | |
| Majority | 4,509 | 10.0 | -3.5 | ||
| Turnout | 45,246 | 60.7 | +2.9 | ||
| Labour hold | Swing | ||||
| Party | Candidate | Votes | % | ± | |
|---|---|---|---|---|---|
| Labour | Geoffrey Robinson | 19,936 | 42.8 | -5.2 | |
| Conservative | Gary Ridley | 13,648 | 29.3 | +2.7 | |
| Liberal Democrat | Vincent McKee | 8,344 | 17.9 | -0.5 | |
| BNP | Edward Sheppard | 1,666 | 3.6 | -0.1 | |
| UKIP | Mark Nattrass | 1,295 | 2.8 | +1.0 | |
| Independent | Nobby Clarke | 640 | 1.4 | +1.4 | |
| Green | Justin Wood | 497 | 1.1 | +1.1 | |
| Socialist Alternative | Nicky Downes | 370 | 0.8 | -0.7 | |
| Christian Movement for Great Britain | William Sidhu | 164 | 0.4 | +0.4 | |
| Majority | 6,288 | 13.5 | |||
| Turnout | 46,560 | 63.9 | +3.8 | ||
| Labour hold | Swing | -3.9 | |||
Elections in the 2000s
| Party | Candidate | Votes | % | ± | |
|---|---|---|---|---|---|
| Labour | Geoffrey Robinson | 20,942 | 48.2 | −3.2 | |
| Conservative | Brian Connell | 11,627 | 26.8 | +0.9 | |
| Liberal Democrat | Iona Anderson | 7,932 | 18.3 | +4.6 | |
| BNP | David Clarke | 1,556 | 3.6 | N/A | |
| UKIP | Sandra List | 766 | 1.8 | +0.3 | |
| Socialist Alternative | Nicky Downes | 615 | 1.4 | N/A | |
| Majority | 9,315 | 21.4 | |||
| Turnout | 43,438 | 59.4 | +3.9 | ||
| Labour hold | Swing | −2.0 | |||
| Party | Candidate | Votes | % | ± | |
|---|---|---|---|---|---|
| Labour | Geoffrey Robinson | 21,892 | 51.4 | -5.4 | |
| Conservative | Andrew Fairburn | 11,018 | 25.9 | -0.4 | |
| Liberal Democrat | Napier Penlington | 5,832 | 13.7 | +3.2 | |
| Independent (politician) | Christine Oddy | 3,159 | 7.4 | N/A | |
| UKIP | Mark Benson | 650 | 1.5 | N/A | |
| Majority | 10,874 | 25.5 | |||
| Turnout | 42,551 | 55.5 | -15.2 | ||
| Labour hold | Swing | ||||
Elections in the 1990s
| Party | Candidate | Votes | % | ± | |
|---|---|---|---|---|---|
| Labour | Geoffrey Robinson | 30,901 | 56.86 | ||
| Conservative | Paul Bartlett | 14,300 | 26.33 | ||
| Liberal Democrat | Napier Penlington | 5,690 | 10.48 | ||
| Referendum | Douglas Butler | 1,269 | 2.34 | ||
| Socialist Labour | Dave Spencer | 940 | 1.73 | ||
| Liberal | Rob Wheway | 687 | 1.27 | ||
| ProLife Alliance | Paul Mills | 359 | 0.66 | ||
| Rainbow Dream Ticket | Leslie Francis | 176 | 0.32 | ||
| Majority | 16,601 | 30.56 | |||
| Turnout | 54,322 | 70.69 | |||
| Labour hold | Swing | ||||
| Party | Candidate | Votes | % | ± | |
|---|---|---|---|---|---|
| Labour | Geoffrey Robinson | 20,349 | 51.7 | +2.7 | |
| Conservative | Mrs Agnes A.B. Hill | 13,917 | 35.4 | +0.6 | |
| Liberal Democrat | Mrs Ann Simpson | 5,070 | 12.9 | −3.4 | |
| Majority | 6,432 | 16.4 | +2.1 | ||
| Turnout | 39,336 | 77.6 | +2.9 | ||
| Labour hold | Swing | +1.0 | |||
Elections in the 1980s
| Party | Candidate | Votes | % | ± | |
|---|---|---|---|---|---|
| Labour | Geoffrey Robinson | 19,450 | 49.00 | ||
| Conservative | J Powell | 13,787 | 34.73 | ||
| Social Democratic | T Jones | 6,455 | 16.26 | ||
| Majority | 5,663 | 14.27 | |||
| Turnout | 74.76 | ||||
| Labour hold | Swing | ||||
| Party | Candidate | Votes | % | ± | |
|---|---|---|---|---|---|
| Labour | Geoffrey Robinson | 17,239 | 44.29 | ||
| Conservative | Anthony Michael Vincent Coombs | 14,201 | 36.49 | ||
| Liberal | W Talbot | 7,479 | 19.22 | ||
| Majority | 3,038 | 7.81 | |||
| Turnout | 74.74 | ||||
| Labour hold | Swing | ||||
Elections in the 1970s
| Party | Candidate | Votes | % | ± | |
|---|---|---|---|---|---|
| Labour | Geoffrey Robinson | 19,460 | 50.13 | ||
| Conservative | D Miles | 15,489 | 39.90 | ||
| Liberal | C Poole | 3,413 | 8.79 | ||
| National Front | A Stewart | 359 | 0.92 | ||
| More Prosperous Britain | Tom Keen | 98 | 0.25 | ||
| Majority | 3,971 | 10.23 | |||
| Turnout | 79.21 | ||||
| Labour hold | Swing | ||||
| Party | Candidate | Votes | % | ± | |
|---|---|---|---|---|---|
| Labour | Geoffrey Robinson | 17,118 | 47.72 | -4.14 | |
| Conservative | Jonathan Guinness | 13,424 | 37.42 | +6.08 | |
| Liberal | Alan Leighton | 4,062 | 11.32 | -4.34 | |
| National Front | Andrew Fountaine | 986 | 2.75 | N/A | |
| National Party | John Kingsley Read | 208 | 0.60 | N/A | |
| More Prosperous Britain | Thomas Keen | 40 | 0.11 | N/A | |
| Logic Party | William Dunmore | 33 | 0.09 | N/A | |
| Majority | 3,694 | 10.3 | |||
| Turnout | 35,871 | ||||
| Labour hold | Swing | ||||
| Party | Candidate | Votes | % | ± | |
|---|---|---|---|---|---|
| Labour | Maurice Edelman | 19,205 | 51.86 | ||
| Conservative | Jonathan Guinness | 11,717 | 31.64 | ||
| Liberal | P Newnham | 5,798 | 15.66 | ||
| People | Lesley Whittaker | 313 | 0.85 | ||
| Majority | 7,488 | 20.22 | |||
| Turnout | 75.20 | ||||
| Labour hold | Swing | ||||
| Party | Candidate | Votes | % | ± | |
|---|---|---|---|---|---|
| Labour | Maurice Edelman | 22,089 | 56.55 | ||
| Conservative | C L Wade | 15,431 | 39.50 | ||
| People | Lesley Whittaker | 1,542 | 3.95 | ||
| Majority | 6,658 | 17.04 | |||
| Turnout | 79.78 | ||||
| Labour hold | Swing | ||||
See also
Notes and references
- Notes
- ↑ A borough constituency (for the purposes of election expenses and type of returning officer)
- ↑ As with all constituencies, the constituency elects one Member of Parliament (MP) by the first past the post system of election at least every five years.
- References
- ↑ "Electorate Figures - Boundary Commission for England". 2011 Electorate Figures. Boundary Commission for England. 4 March 2011. Archived from the original on 6 November 2010. Retrieved 13 March 2011.
- ↑ Leigh Rayment's Historical List of MPs – Constituencies beginning with "C" (part 6)
- ↑ "Election Data 2015". Electoral Calculus. Archived from the original on 17 October 2015. Retrieved 17 October 2015.
- ↑ http://www.bbc.co.uk/news/politics/constituencies/E14000650
- ↑ https://my.greenparty.org.uk/candidates/105904
- ↑ "Election Data 2010". Electoral Calculus. Archived from the original on 26 July 2013. Retrieved 17 October 2015.
- ↑ "Coventry North West". YourNextMP. Retrieved 6 April 2010.
- ↑ "UK > England > West Midlands > Coventry North West". Election 2010. BBC. 7 May 2010. Retrieved 14 May 2010.
- ↑ "Election Data 2005". Electoral Calculus. Archived from the original on 15 October 2011. Retrieved 18 October 2015.
- ↑ "Election Data 2001". Electoral Calculus. Archived from the original on 15 October 2011. Retrieved 18 October 2015.
- ↑ "Election Data 1997". Electoral Calculus. Archived from the original on 15 October 2011. Retrieved 18 October 2015.
- ↑ "Election Data 1992". Electoral Calculus. Archived from the original on 15 October 2011. Retrieved 18 October 2015.
- ↑ "UK General Election results April 1992". Richard Kimber's Political Science Resources. Politics Resources. 9 April 1992. Retrieved 2010-12-06.
- ↑ "Election Data 1987". Electoral Calculus. Archived from the original on 15 October 2011. Retrieved 18 October 2015.
- ↑ "Election Data 1983". Electoral Calculus. Archived from the original on 15 October 2011. Retrieved 18 October 2015.
Coordinates: 52°26′N 1°34′W / 52.43°N 1.56°W
This article is issued from Wikipedia - version of the 11/4/2016. The text is available under the Creative Commons Attribution/Share Alike but additional terms may apply for the media files.