Deglaciation
Deglaciation, describes the transition from full glacial conditions during ice ages, to warm interglacials, characterized by global warming and sea level rise due to change in continental ice volume (IPCC AR5).[1] Thus,it refers to the retreat of a glacier, an ice sheet or frozen surface layer, and the resulting exposure of the Earth's surface. The decline of the cryosphere due to ablation can occur on any scale from global to localized to a particular glacier. After the Last Glacial Maximum (ca. 21k years ago), the last deglaciation begun, which lasted until the early Holocene.[2][3]
Background
The process of deglaciation reflects a lack of balance between existing glacial extent and climatic conditions. As a result of net negative mass balance over time, glaciers and ice sheets retreat. The repeated periods of increased and decreased extent of the global cryposhere (as deduced from observations of ice and rock cores, surface landforms, sub-surface geologic structures, the fossil record, and other methods of dating) reflect the cyclical nature of global and regional glaciology measured by ice ages and smaller periods known as glacials and interglacials.[4][5] Since the end of the Last glacial period about 12,000 years ago, ice sheets have retreated on a global scale, and Earth has been experiencing a relatively warm interglacial period marked by only high-altitude alpine glaciers at most latitudes with larger ice sheet and sea ice at the poles.[6] However, since the onset of the Industrial Revolution, human activity has contributed to a rapid increase in the speed and scope of deglaciation globally.[7][8]
Greenland
Research published in 2014 suggests that below Greenland's Russell Glacier's ice sheet, methanotrophs could serve as a biological methane sink for the subglacial ecosystem, and the region was at least during the sample time, a source of atmospheric methane. Based on dissolved methane in water samples, Greenland may represent a significant global methane source, and may contribute significantly more due to ongoing deglaciation.[9] A study in 2016 concluded based on past evidence, that below Greenland's and Antarctica's ice sheet may exist methane clathrates.[10]
Causes and Effects
At every scale, climate influences the condition of snow and ice on Earth's surface. In colder periods massive ice sheets may extend toward the Equator, while in periods warmer than today, the Earth may be completely free of ice. A significant, empirically demonstrated, positive relationship exists between the surface temperature and concentration of Greenhouse gases such as CO2 in the atmosphere. The higher concentration, in turn, has a drastic negative impact on the global extent and stability of the cryosphere.[11][12]
Human activities promoting climate change, notably the extensive use of fossil fuels over the last 150 years and the resulting increase in atmospheric CO2 concentrations, are the principal cause of the more rapid retreat of alpine glaciers and continental ice sheets all across the world.[7] For example, the West Antarctic Ice Sheet has receded significantly, and is now contributing to a positive feedback loop that threatens further deglaciation or collapse. Newly exposed areas of the Southern Ocean contain long-sequestered stores of CO2 which are now being emitted into the atmosphere and are continuing to impact glacial dynamics.[12]
The principle of isostasy applies directly to the process of deglaciation, especially post-glacial rebound, which is one of main mechanisms through which isostasy is observed and studied. Post-glacial rebound refers to the increase in tectonic uplift activity immediately following glacial retreat.[13] Increased rates and abundance of volcanic activity have been found in regions experiencing post-glacial rebound. If on a large enough scale, an increase in volcanic activity provides a positive feedback to the process of deglaciation as a result CO2 and methane released from volcanos.[14][15]
Periods of deglaciation are also caused in part by oceanic processes.[16] For example, interruptions of the usual deep cold water circulation and penetration depths in the North Atlantic have feedbacks that promote further glacial retreat.[17]
Deglaciation influences sea level because water previously held on land in solid form turns into liquid water and eventually drains into the ocean. The recent period of intense deglaciation has resulted in an average global sea level rise of 1.7 mm/year for the entire 20th century, and 3.2 mm/year over the past two decades, a very rapid increase.[18]
The physical mechanisms by which deglaciation occurs include melting, evaporation, sublimation, calving, and aeolian processes such as wind scouring.
The last deglaciation
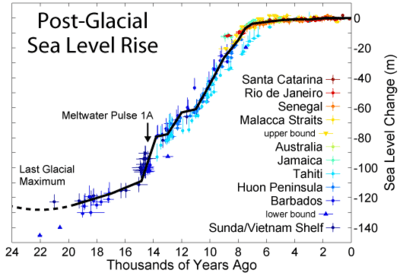
The period between the end of the Last Glacial Maximum to the early Holocene (ca. 19k-11k years ago), shows changes in greenhouse gas concentrations and of the Atlantic meridional overturning circulation (AMOC), when sea-level rose by 80 meters.[3] Additionally, the last deglaciation is marked by three abrupt CO2 pulses,[19] and records of volcanic eruptions show that subaerial volcanism increased globally by two to six times above background levels between 12 ka and 7 ka.[20]
Landforms
Several landforms visible today are distinctive of the powerful erosional forces at play during, or immediately after, deglaciation. The distribution of such landforms helps to inform the understanding of the glacial dynamics and geologic periods of the past. Studying exposed landforms can also inform the understanding of the present and near future as glaciers all over the world retreat in the current period of climate change.[21] In general, recently deglacialized landscapes are inherently unstable and will tend to move towards an equilibrium.[22]
A sampling of common landforms caused by deglaciation, or caused by the successive geomorphic processes after exposure due to deglaciation:
See also
- Cryoseism
- Timeline of glaciation
- Quaternary glaciation
- Late Glacial Maximum
- Last glacial period
- Antarctic Cold Reversal
- Glacial erratic
- Glacial till
- Holocene glacial retreat
- Retreat of glaciers since 1850
References
- ↑ IPCC AR5 (2013). "Climate Change 2013: The Physical Science Basis - Annex III: Glossary" (PDF).
- ↑ IPCC (2007). "What Do the Last Glacial Maximum and the Last Deglaciation Show?".
- 1 2 Clark; et al. (2011). "Global climate evolution during the last deglaciation". PNAS. doi:10.1073/pnas.1116619109.
- ↑ Jiménez-Sánchez, M.; et al. (2013). "A review of glacial geomorphology and chronology in northern Spain: Timing and regional variability during the last glacial cycle". 196: 50–64. doi:10.1016/j.geomorph.2012.06.009.
- ↑ Bentley, M.J., 2009, The Antarctic palaeo record and its role in improving predictions of future Antarctic Ice Sheet change: Journal of Quaternary Science, v. 25, no. 1, p. 5-18, doi: 10.1002/jqs.1287
- ↑ Carlson, A.E., and Clark, P.U., 2012, Ice sheet sources of sea level rise and freshwater discharge during the last deglaciation: Reviews of Geophysics, v. 50, no. 4, doi:10.1029/2011RG000371
- 1 2 Hanna, E., et al., 2013, Ice-sheet mass balance and climate change: Nature, v. 498, p. 51-59, doi: 10.1038/nature12238
- ↑ Straneo, F., and Helmbach, P., 2013, North Atlantic warming and the retreat of Greenland's outlet glaciers: Nature, v. 504, p. 36-43, doi: 10.1038/nature12854
- ↑ Markus Dieser; Erik L J E Broemsen; Karen A Cameron; Gary M King; Amanda Achberger; Kyla Choquette; Birgit Hagedorn; Ron Sletten; Karen Junge & Brent C Christner (2014). "Molecular and biogeochemical evidence for methane cycling beneath the western margin of the Greenland Ice Sheet". The ISME Journal.
- ↑ Alexey Portnov; Sunil Vadakkepuliyambatta; Jürgen Mienert & Alun Hubbard (2016). "Ice-sheet-driven methane storage and release in the Arctic". Nature Communications. doi:10.1038/ncomms10314.
- ↑ Lewis, S.L., and Maslin, M.A., 2015, Defining the Anthropocene: Nature, v. 519, p. 171-180, doi: 10.1038/nature14258
- 1 2 Sigman, D.M., Hain, M.P., and Haug, G.H., 2010, The polar ocean and glacial cycles in atmospheric CO2 concentration: Nature, v. 466, p. 47-55, doi: 10.1038/nature09149
- ↑ Árnadóttir, T., et al., 2008, Glacial rebound and plate spreading: Results from the first countrywide GPS observations in Iceland: Geophysical Journal International, v. 177, no. 2, p. 691-716, doi: 10.1111/j.1365-246X.2008.04059.x
- ↑ Huybers, P., and Langmuir, C., 2009, Feedback between deglaciation, volcanism, and atmospheric CO2: Earth and Planetary Science Letters, v. 286, no. 3-4, p. 479-491, doi: 10.1016/j.epsl.2009.07.014
- ↑ Sinton, J., Grönvold, K., and Sæmundsson, K., 2005, Postglacial eruptive history of the Western Volcanic Zone, Iceland: Geochemistry, Geophysics, Geosystems, v. 6, no. 12, doi: 10.1029/2005GC001021
- ↑ Allen, C.S., Pike, J., and Pudsey, C.J., 2011, Last glacial–interglacial sea-ice cover in the SW Atlantic and its potential role in global deglaciation: Quaternary Science Reviews, v. 30, no. 19-20, p. 2446–2458, doi: 10.1016/j.quascirev.2011.04.002
- ↑ Alley, R.B., and Clark, P.U., 1999, THE DEGLACIATION OF THE NORTHERN HEMISPHERE: A Global Perspective: Annual Review of Earth and Planetary Sciences, v. 27, p. 149-182, doi: 10.1146/annurev.earth.27.1.149
- ↑ Meyssignac, B., and Cazenave, A., 2012, Sea level: A review of present-day and recent-past changes and variability: Journal of Geodynamics, v. 58, p. 96-109, doi: 10.1016/j.jog.2012.03.005
- ↑ "New study shows three abrupt pulse of CO2 during last deglaciation". Oregon State University. 29 October 2014.
- ↑ Peter Huybers; Charles Langmuir (2009). "Feedback between deglaciation, volcanism, and atmospheric CO2" (PDF). Earth and Planetary Science Letters. doi:10.1016/j.epsl.2009.07.014.
- ↑ Cowie, N.M., Moore, R.D., and Hassan, M.A., 2013, Effects of glacial retreat on proglacial streams and riparian zones in the Coast and North Cascade Mountains: Earth Surface Processes and Landforms, v. 29, no. 3, p. 351-365, doi: 10.1002/esp.3453
- ↑ Ballantyne, C.K., 2002, Paraglacial geomorphology: Quaternary Science Reviews, v. 21, no. 18-19, p. 1935-2017, doi: 10.1016/S0277-3791(02)00005-7