Dutch general election, 1952
Dutch general election, 1952

|
|
|
|
All 100 seats to the House of Representatives
51 seats were needed for a majority |
| Turnout |
95.0% |
| |
First party |
Second party |
Third party |
| |
 |
 |
 |
| Leader |
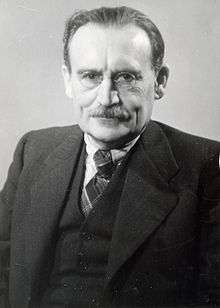
Willem Drees |
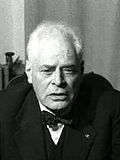
Carl Romme |
Jan Schouten |
| Party |
PvdA |
KVP |
ARP |
| Leader since |
1946 |
1946 |
1945 |
| Last election |
27 seats, 25.6% |
32 seats, 31.0% |
13 seats, 13.1% |
| Seats won |
30 |
30 |
12 |
| Seat change |
 3 3 |
 2 2 |
1 |
| Popular vote |
1,545,867 |
1,529,434 |
603,329 |
| Percentage |
29.0% |
28.7% |
11.3% |
|
| |
Fourth party |
Fifth party |
Sixth party |
| |
 |
 |
 |
| Leader |
Hendrik Tilanus |
Pieter Oud |
Paul de Groot |
| Party |
CHU |
VVD |
CPN |
| Leader since |
1939 |
1948 |
1945 |
| Last election |
9 seats, 9.2% |
8 seats, 8.0% |
8 seats, 7.7% |
| Seats won |
9 |
9 |
6 |
| Seat change |
 |
1 |
2 |
| Popular vote |
476,195 |
471,040 |
328,621 |
| Percentage |
8.9% |
8.8% |
6.2% |
|
| |
Seventh party |
Eighth party |
| |
 |
 |
| Leader |
Charles Welter |
Pieter Zandt |
| Party |
KNP |
SGP |
| Leader since |
1948 |
1945 |
| Last election |
1 seat, 1.3% |
2 seats, 2.4% |
| Seats won |
2 |
2 |
| Seat change |
1 |
|
| Popular vote |
144,520 |
129,081 |
| Percentage |
2.7% |
2.4% |
|
|
|
General elections were held in the Netherlands on 25 June 1952.[1] The Catholic People's Party and the Labour Party both won 30 of the 100 seats in the House of Representatives.[2] It was the first time since 1913 that the Catholic People's Party and its predecessors had not received a plurality of the vote.[3]
Results
| Party |
Votes |
% |
Seats |
+/– |
|---|
| Labour Party | 1,545,867 | 29.0 | 30 | +3 |
| Catholic People's Party | 1,529,508 | 28.7 | 30 | –2 |
| Anti Revolutionary Party | 603,329 | 11.3 | 12 | –1 |
| Christian Historical Union | 476,195 | 8.9 | 9 | 0 |
| People's Party for Freedom and Democracy | 471,040 | 8.8 | 9 | +1 |
| Communist Party of the Netherlands | 328,621 | 6.2 | 6 | –2 |
| Catholic National Party | 144,520 | 2.7 | 2 | +1 |
| Reformed Political Party | 129,081 | 2.4 | 2 | 0 |
| Reformed Political League | 107,584 | 2.1 | 0 | New |
| Middle Class Party | 0 | 0 |
| Party for Justice, Freedom and Welfare | 0 | New |
| Socialist Union | 0 | New |
| Young Conservative Union | 0 | 0 |
| Invalid/blank votes | 165,981 | – | – | – |
| Total | 5,501,726 | 100 | 100 | 0 |
| Registered voters/turnout | 5,792,679 | 95.0 | – | – |
| Source: Nohlen & Stöver |
| Popular Vote |
|---|
|
|
|
|
|
| PvdA |
|
28.97% |
| KVP |
|
28.67% |
| ARP |
|
11.31% |
| CHU |
|
8.92% |
| VVD |
|
8.83% |
| CPN |
|
6.16% |
| KNP |
|
2.71% |
| SGP |
|
2.42% |
| GPV |
|
0.67% |
| Other |
|
1.35% |
References
- ↑ Nohlen, D & Stöver, P (2010) Elections in Europe: A data handbook, p1396 ISBN 978-3-8329-5609-7
- ↑ Nohlen & Stöver, p1413
- ↑ Nohlen & Stöver, pp1402-1406