European Parliament election, 2014 (United Kingdom)
| | |||||||||||||||||||||||||||||||||||||||||||||||||||||||||||||||||||||||||||||||||||||||||||||||||||||||||||||||||||
| |||||||||||||||||||||||||||||||||||||||||||||||||||||||||||||||||||||||||||||||||||||||||||||||||||||||||||||||||||
| |||||||||||||||||||||||||||||||||||||||||||||||||||||||||||||||||||||||||||||||||||||||||||||||||||||||||||||||||||
|
| |||||||||||||||||||||||||||||||||||||||||||||||||||||||||||||||||||||||||||||||||||||||||||||||||||||||||||||||||||
| |||||||||||||||||||||||||||||||||||||||||||||||||||||||||||||||||||||||||||||||||||||||||||||||||||||||||||||||||||
.jpg)

.jpg)
The United Kingdom's component of the 2014 European Parliament election was held on Thursday 22 May 2014,[3][4] coinciding with the 2014 local elections in England[5] and Northern Ireland. Given the subsequent Leave vote in the 23 June 2016 referendum, it is possible that this will be the last time the UK participates in a European Parliament election.[6]
Most of the results of the election were announced on Sunday 25 May, after voting closed throughout the 28 member states of the European Union. In total, 73 Members of the European Parliament were elected from the United Kingdom using proportional representation. England, Scotland and Wales use a closed-list party list system of PR (with the D'Hondt method), while Northern Ireland used the single transferable vote (STV).
The UK Independence Party (UKIP) came top of the poll – the first time a political party other than the Labour Party or Conservative Party has won the popular vote in a British election since the 1906 general election.[7][8] It is also the first time a party other than the Labour and Conservatives won the largest number of seats in a national election since the December 1910 general election.[9][10][11]
The Conservatives, the party at the time in governing coalition with the Liberal Democrats, were pushed into third place for the first time in a European Parliament election, the same position as Labour in the previous 2009 European Parliament election.[12] It was also the first time since 1984 that the largest opposition party failed to win the European Parliament election.
Figures released in December 2014 showed that the Conservatives and UKIP each spent £2.96m on the campaign, the Liberal Democrats £1.5 million and the Labour party approximately £1m.[13]
Results
.svg.png)
| Party | Euro Party | Euro Group | Votes | Seats | |||||||
|---|---|---|---|---|---|---|---|---|---|---|---|
| Number | % | +/- | Number | +/- | % | ||||||
| UK Independence Party | None (later ADDE) | EFDD | 4,376,635 | 26.60% | | 24 | | 32.88% | |||
| Labour Party | PES | S&D | 4,020,646 | 24.43% | | 20 | | 27.40% | |||
| Conservative Party | AECR | ECR | 3,792,549 | 23.05% | | 19 | | 26.03% | |||
| Green Party of England and Wales | EGP | G-EFA | 1,136,670 | 6.91% | | 3 | | 4.11% | |||
| Scottish National Party | EFA | G-EFA | 389,503 | 2.37% | | 2 | | 2.74% | |||
| Liberal Democrats | ALDE | ALDE | 1,087,633 | 6.61% | | 1 | | 1.37% | |||
| Sinn Féin | None | EUL-NGL | 159,813 | 0.97% | | 1 | | 1.37% | |||
| Democratic Unionist Party | None | None | 131,163 | 0.80% | | 1 | | 1.37% | |||
| Plaid Cymru | EFA | G-EFA | 111,864 | 0.68% | | 1 | | 1.37% | |||
| Ulster Unionist Party | AECR | ECR | 83,438 | 0.51% | | 1 | | 1.37% | |||
| An Independence from Europe | None | None | 235,124 | 1.43% | New | 0 | New | 0.00% | |||
| British National Party | AENM | None | 179,694 | 1.09% | | 0 | | 0.00% | |||
| English Democrats | None | None | 126,024 | 0.77% | | 0 | | 0.00% | |||
| Scottish Green Party | EGP | None | 108,305 | 0.66% | | 0 | | 0.00% | |||
| Social Democratic and Labour Party | PES | None | 81,594 | 0.50% | | 0 | | 0.00% | |||
| Traditional Unionist Voice | None | None | 75,806 | 0.46% | | 0 | | 0.00% | |||
| Christian Peoples Alliance | ECPM | None | 50,222 | 0.31% | | 0 | | 0.00% | |||
| Alliance Party of Northern Ireland | None | None | 44,432 | 0.27% | | 0 | | 0.00% | |||
| No2EU | None | None | 31,757 | 0.19% | | 0 | | 0.00% | |||
| 4 Freedoms Party (UK EPP) | None | None | 28,014 | 0.17% | New | 0 | New | 0.00% | |||
| We Demand a Referendum Now | None | None | 23,426 | 0.14% | New | 0 | New | 0.00% | |||
| National Health Action Party | None | None | 23,253 | 0.14% | New | 0 | New | 0.00% | |||
| Animal Welfare Party | None | None | 21,092 | 0.13% | | 0 | | 0.00% | |||
| Britain First | None | None | 20,272 | 0.12% | New | 0 | New | 0.00% | |||
| Yorkshire First | None | None | 19,017 | 0.12% | New | 0 | New | 0.00% | |||
| Europeans Party | None | None | 10,712 | 0.07% | New | 0 | New | 0.00% | |||
| Green Party in Northern Ireland | EGP | None | 10,598 | 0.06% | | 0 | | 0.00% | |||
| NI21 | None | None | 10,553 | 0.06% | New | 0 | New | 0.00% | |||
| Peace Party | None | None | 10,130 | 0.06% | | 0 | | 0.00% | |||
| Others | Various | None | 55,011 | 0.33% | | 0 | | 0.00% | |||
| Valid Votes | 16,454,950 | 100.00% | 73 | | 100.00% | ||||||
| Rejected Votes | 90,812 | 0.55% | |||||||||
| Total Polled | 16,545,762 | ||||||||||
| Verified Votes | 34.19% | ||||||||||
| Registered Electors | |||||||||||
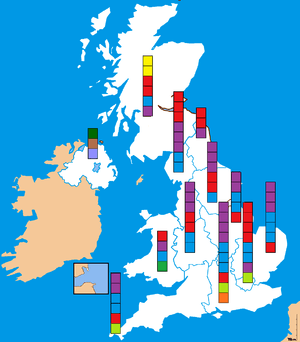
Election results by constituency[14]
MEPs defeated
Conservative
- Marina Yannakoudakis – London
- Martin Callanan – North East
- Marta Andreasen – South East
Liberal Democrats
- Bill Newton Dunn – East Midlands
- Andrew Duff – East of England
- Sarah Ludford – London
- Chris Davies – North West
- Graham Watson – South West
- Phil Bennion – West Midlands
- Edward McMillan-Scott – Yorkshire and the Humber
- George Lyon – Scotland
British National Party
- Nick Griffin – North West
An Independence from Europe
- Mike Nattrass – West Midlands
We Demand a Referendum
- Nikki Sinclaire – West Midlands
MEPs before the 2014 election, by European Parliament group
Between the 2009 and 2014 elections, there were various changes to the breakdown of UK members. In December 2011 a 73rd member from the UK (Anthea McIntyre, Conservative) was allocated to England because of the implementation of the Treaty of Lisbon. There were also various defections:
- one Conservative MEP (Edward McMillan-Scott) defected to the Liberal Democrats (March 2010);[16]
- one Conservative MEP (Roger Helmer) defected to UKIP (March 2012);
- two UKIP MEPs (David Campbell Bannerman in May 2011[17] and Marta Andreasen in February 2013) defected to the Conservatives;[18]
- one UKIP MEP (Nikki Sinclaire) left the party and later founded the We Demand a Referendum party;
- one UKIP MEP (Mike Nattrass) left the party in September 2013 and later founded An Independence from Europe;[19]
- one UKIP MEP (Godfrey Bloom) left the party in September 2013 and sat as an independent;[20]
- one BNP MEP (Andrew Brons) left the party and later founded the British Democratic Party.
The Ulster Conservatives and Unionists - New Force (UCUNF) electoral pact between the Conservatives and the Ulster Unionist Party (UUP) was dissolved.
Thus, before the 2014 election, the following parties had MEPs representing UK constituencies:
| Parties in the European Parliament (UK) before the 2014 election | |||||
|---|---|---|---|---|---|
| United Kingdom party | Seats/73 | European Parliament group | Seats/766 | ||
| Conservative | 26 | European Conservatives and Reformists | 52 | ||
| UUP | 1 | ||||
| Labour | 13 | Progressive Alliance of Socialists and Democrats | 195 | ||
| Liberal Democrats | 12 | Alliance of Liberals and Democrats for Europe | 75 | ||
| UKIP | 9 | Europe of Freedom and Democracy | 31 | ||
| Independent | 1 | ||||
| Green | 2 | The Greens–European Free Alliance | 52 | ||
| Scottish National | 2 | ||||
| Plaid Cymru | 1 | ||||
| Sinn Féin | 1 | European United Left–Nordic Green Left | 35 | ||
| Democratic Unionist | 1 | Non-Inscrits | – | ||
| British Democratic | 1 | – | |||
| British National | 1 | – | |||
| We Demand a Referendum | 1 | – | |||
| An Independence from Europe | 1 | – | |||
Voting system and regional representation
.jpg)
As has been the case since 1999, the election is conducted in a total of 12 electoral constituencies: using the regional Party-list proportional representation system, in each of the government's nine English regions, and in Scotland and in Wales, but the Single transferable vote system in Northern Ireland. As a result of the Treaty of Lisbon coming into force, the UK became entitled to a 73rd MEP as from November 2011. The Electoral Commission performed a reallocation in keeping with the same procedures they used to allocate 72 MEPs and an extra Conservative MEP was allocated to the West Midlands constituency based on the 2009 vote.[21]
| Electoral region | Representation in 2009 | Representation before and after the 2014 election | Net Gain/Loss |
|---|---|---|---|
| East Midlands | 5 | 5 | |
| East of England | 7 | 7 | |
| London | 8 | 8 | |
| North East England | 3 | 3 | |
| North West England | 8 | 8 | |
| South East England | 10 | 10 | |
| South West England1 | 6 | 6 | |
| West Midlands | 6 | 7 | +1 |
| Yorkshire and the Humber | 6 | 6 | |
| Wales | 4 | 4 | |
| Scotland | 6 | 6 | |
| Northern Ireland | 3 | 3 |
1 Includes Gibraltar, the only British overseas territory which is part of the European Union.
Returning officers
The European Parliamentary Elections (Returning Officers) Order 2013 provides for the designated Returning Officer for each electoral region to be the council official responsible for elections in each of the following Westminster constituencies: Kettering for the East Midlands, Chelmsford for the Eastern region, Lewisham, Deptford for the London region, Sunderland Central for the North East region, Manchester Central for the North West region, Falkirk for Scotland, Southampton, Test for the South East region, Poole for the South West region, Preseli Pembrokeshire for Wales, Birmingham Ladywood for the West Midlands region, Leeds Central for the Yorkshire and Humber region, and Belfast South for the Northern Ireland Region[22]
Parties and candidates
39 parties stood a total of 747 candidates. The Conservative Party and UKIP had candidates in every region, as did the three Green parties. Labour, the Liberal Democrats and the BNP had a full slate of candidates in all the regions in Great Britain (i.e. excluding Northern Ireland). The English Democrats and An Independence from Europe had a full slate of candidates in all the English regions. No2EU had a full slate in seven regions, while Britain First and the Socialist Party of Great Britain had full slates in two regions each. The Harmony Party stood in four regions and the Christian Peoples Alliance in three regions. Other parties only stood in one region.
Retiring/resigned incumbents
British Democratic Party
(Elected in 2009 as British National Party)
- Andrew Brons – Yorkshire and the Humber
Conservative
- Struan Stevenson (Scotland)[23]
- Sir Robert Atkins (North West England)[23]
- Giles Chichester (South West England and Gibraltar)[23]
- Robert Sturdy (East of England)[23]
Green
- Caroline Lucas (South East England) – Resigned 17 May 2010 & replaced by Keith Taylor
Labour
- Michael Cashman (West Midlands)[24]
- Stephen Hughes (North East England)[25]
- Arlene McCarthy (North West England)
- Brian Simpson (North West England)[26]
- Peter Skinner (South East England)[27]
Liberal Democrats
- Diana Wallis (Yorkshire and the Humber) – Resigned 31 January 2012[28] & replaced by Rebecca Taylor
- Liz Lynne (West Midlands) – Resigned 4 February 2012[29] & replaced by Phil Bennion
- Sharon Bowles – (South East England)[30]
- Rebecca Taylor (Yorkshire and the Humber)
- Fiona Hall (North East England)
UKIP
- John Bufton (Wales)[31]
- Trevor Colman (South West England and Gibraltar)
- Derek Clark (East Midlands)[32]
- Godfrey Bloom (Yorkshire & Humber), Having spent the last 8 months of his term as an independent[33][34]
Debates
On 20 February, the Deputy Prime Minister Nick Clegg used his weekly phone-in show on LBC 97.3 to challenge the leader of the UK Independence Party, Nigel Farage, to a live public debate on the UK's membership of the European Union.[35] Clegg said, "he is the leader of the party of 'out'; I am the leader of the party of 'in'. I think it's time we now have a proper, public debate so that the public can listen to the two sides of the argument and judge from themselves."[36][37] Farage accepted, but said he would also like to see Ed Miliband and David Cameron participate.[38]
The first hour-long debate between the two men was held on 26 March 2014 and was broadcast live on television by Sky News and on the BBC News Channel. The debate was hosted by LBC and moderated by Nick Ferrari.[39] After the first debate, a YouGov poll asked "Who performed better?", with 57% saying Farage did better compared to 36% for Clegg.
The second debate was held on BBC Two on 2 April in a special programme called The European Union: In or Out, moderated by David Dimbleby. Farage was again seen as outperforming his rival, with a snap poll by YouGov showing 68% of people thought he did better in the debate compared to 27% for Clegg. A snap Guardian poll also showed that 69% thought Farage won the debate.[40]
Despite David Cameron and Ed Miliband declining to participate in the leaders' debates, the Conservative and Labour parties were represented in a lower-profile debate on the BBC. On 13 February Andrew Neil hosted a four-way debate on the BBC's Sunday Politics programme. The Conservatives were represented by Syed Kamall MEP, Labour by Richard Howitt MEP, the Liberal Democrats by Baroness Sarah Ludford MEP and the UK Independence Party by Patrick O'Flynn, the party's Director of communications and an MEP candidate.[41][42]
Opinion polls
These opinion polls are for Great Britain and generally exclude Northern Ireland. The methodology used for these polls broadly corresponds to that used for opinion polling for the next United Kingdom general election; see that article for the methodology used by each polling company. YouGov have experimented with different methods of polling for these elections, using their own method for their 8–9 January 2013 poll and another corresponding to that used by Survation and ComRes for their 10–11 January 2013 poll (both below) and argue that their method gives more accurate answers.[43] Data for these polls are generally gathered at the same time as the data for General Election polling.
2014
| Date(s) conducted | Polling organisation/client | Sample size | Con | UKIP | Lab | Lib Dem | Others | Lead |
|---|---|---|---|---|---|---|---|---|
| 22 May 2014 | European Parliament election, 2014 (Great Britain) Results | 16,017,366 | 23.93% | 27.49% | 25.40% | 6.87% | 16.31% | 2.09 pts over Lab |
| 20–21 May | YouGov/The Sun | 6,124 | 22% | 27% | 26% | 9% | 16% | 1 pt over Lab |
| 19–21 May | Opinium/Daily Mail | 1,967 | 21% | 32% | 25% | 6% | 16% | 7 pts over Lab |
| 19–20 May | Survation/Mirror | 1,106 | 23% | 32% | 27% | 9% | 11% | 5 pts over Lab |
| 19–20 May | YouGov/The Sun | 1,874 | 23% | 27% | 27% | 10% | 14% | Tied |
| 18–19 May | YouGov/The Sun | 1,740 | 21% | 24% | 28% | 10% | 17% | 4 pts over UKIP |
| 15–19 May | TNS | 1,217 | 21% | 31% | 28% | 7% | 13% | 3 pts over Lab |
| 16–18 May | ComRes/ITV News | 2,061 | 20% | 33% | 27% | 7% | 13% | 6 pts over Lab |
| 15–16 May | YouGov/Sunday Times | 1,892 | 23% | 26% | 27% | 9% | 14% | 1 pt over UKIP |
| 13–16 May | Opinium/Daily Mail | 2,036 | 20% | 31% | 29% | 5% | 15% | 2 pts over Lab |
| 14–15 May | ICM/Sunday Telegraph | 2,033 | 26% | 25% | 29% | 7% | 13% | 3 pts over Con |
| 14–15 May | ComRes/Sunday Mirror/Independent on Sunday | 2,045 | 20% | 35% | 24% | 6% | 15% | 11 pts over Lab |
| 13–14 May | YouGov/The Sun | 1,968 | 22% | 25% | 28% | 10% | 15% | 3 pts over UKIP |
| 9–12 May | Opinium | 1,936 | 22% | 30% | 28% | 7% | 13% | 2 pts over Lab |
| 9–11 May | ICM/The Guardian | 1,000 | 27% | 26% | 24% | 7% | 16% | 1 pt over UKIP |
| 9–11 May | ComRes/C4M | 2,056 | 22% | 34% | 24% | 8% | 12% | 10 pts over Lab |
| 9 May | Survation/Mail on Sunday | 1,005 | 21% | 32% | 28% | 9% | 11% | 4 pts over Lab |
| 6–8 May | Opinium/Daily Mail | 1,972 | 23% | 28% | 27% | 8% | 14% | 1 pt over Lab |
| 28 Apr – 6 May | YouGov/Sky News | 1,933 | 23% | 31% | 25% | 9% | 14% | 6 pts over Lab |
| 2–3 May | Survation/Mirror | 1,005 | 24% | 31% | 28% | 7% | 10% | 3 pts over Lab |
| 1–2 May | YouGov/Sunday Times | 1,945 | 22% | 29% | 28% | 7% | 14% | 1 pt over Lab |
| 30 Apr – 1 May | YouGov/Sun on Sunday | 1,844 | 23% | 29% | 26% | 10% | 12% | 3 pts over Lab |
| 30 Apr – 1 May | YouGov/The Sun | 1,813 | 22% | 27% | 30% | 9% | 13% | 3 pts over UKIP |
| 27–30 Apr | YouGov/The Sun | 5,331 | 22% | 28% | 29% | 9% | 13% | 1 pt over UKIP |
| 24–28 Apr | TNS | 1,199 | 18% | 36% | 27% | 10% | 12% | 9 pts over Lab |
| 25–27 Apr | ComRes/ITV News | 2,052 | 18% | 38% | 27% | 8% | 14% | 11 pts over Lab |
| 24–25 Apr | YouGov/Sunday Times | 1,835 | 19% | 31% | 28% | 9% | 13% | 3 pts over Lab |
| 21–22 Apr | YouGov/The Sun | 2,190 | 22% | 27% | 30% | 10% | 11% | 3 pts over UKIP |
| 15–17 Apr | ICM/Sunday Telegraph | 2,000 | 22% | 27% | 30% | 8% | 13% | 3% over UKIP |
| 11–13 Apr | ICM/The Guardian | 1,000 | 25% | 20% | 36% | 6% | 13% | 11 pts over Con |
| 3–7 Apr | TNS | 1,193 | 21% | 29% | 30% | 9% | 11% | 1 pt over UKIP |
| 4–6 Apr | Populus/Financial Times | 2,034 | 27% | 25% | 31% | 10% | 7% | 4 pts over Con |
| 3–4 Apr | YouGov/Sunday Times | 1,998 | 22% | 28% | 30% | 9% | 10% | 2 pts over UKIP |
| 4 Apr | Survation/Mail on Sunday | 1,001 | 21% | 27% | 34% | 9% | 9% | 7 pts over UKIP |
| 2–3 Apr | ComRes/The People | 2,067 | 22% | 30% | 30% | 8% | 10% | Tied |
| 2 Apr | Broadcast of The European Union: In or Out debate. | |||||||
| 27–28 Mar | YouGov/The Sunday Times | 1,916 | 24% | 23% | 32% | 11% | 10% | 8 pts over Con |
| 26–27 Mar | YouGov/The Sun | 2,039 | 24% | 26% | 28% | 11% | 11% | 2 pts over UKIP |
| 26 Mar | LBC radio debate on the European Union between the Lib Dems' Nick Clegg and Nigel Farage of UKIP. | |||||||
| 20–21 Mar | Survation/Mail on Sunday | 1,000 | 28% | 23% | 32% | 7% | 10% | 4 pts over Con |
| 17–18 Mar | YouGov/Times | 2,284 | 24% | 23% | 32% | 10% | 11% | 8 pts over Con |
| 12–13 Mar | ComRes/Independent on Sunday | 2,001 | 21% | 30% | 28% | 8% | 13% | 2 pts over Lab |
| 7–9 Feb | ICM/The Guardian | 1,002 | 25% | 20% | 35% | 9% | 11% | 10 pts over Con |
| 14–15 Jan | YouGov/The Sun | 1,893 | 23% | 26% | 32% | 9% | 10% | 6 pts over UKIP |
| 3 Jan | Survation/Mail on Sunday | 1,001 | 23% | 26% | 32% | 9% | 10% | 6 pts over UKIP |
2013
| Date(s) conducted | Polling organisation/client | Sample size | Con | UKIP | Lab | Lib Dem | Others | Lead |
|---|---|---|---|---|---|---|---|---|
| 21–22 Nov | Survation/Daily Star | 1,006 | 24% | 25% | 32% | 8% | 12% | 7 pts over UKIP |
| 11 Oct | Survation/Mail on Sunday | 1,017 | 21% | 22% | 35% | 11% | 11% | 13 pts over UKIP |
| 22–24 May | ComRes/Open Europe | 2,003 | 21% | 27% | 23% | 18% | 11% | 4 pts over Lab |
| 17–18 May | Survation/Mail on Sunday | 1,000 | 20% | 30% | 31% | 8% | 11% | 1 pt over UKIP |
| 17–18 Jan | YouGov/The Sun | 1,912 | 30% | 12% | 38% | 13% | 10% | 8 pts over Con |
| 10–11 Jan | YouGov/The Sun | 1,995 | 24% | 19% | 36% | 12% | 10% | 12 pts over Con |
| 9–10 Jan | ComRes/Sunday People | 2,002 | 22% | 23% | 35% | 8% | 12% | 12 pts over UKIP |
| 8–9 Jan | YouGov/The Sun | 1,980 | 27% | 17% | 38% | 12% | 6% | 11 pts over Con |
| 5 Jan | Survation/Mail on Sunday | 772 | 24% | 22% | 31% | 11% | 12% | 7 pts over Con |
| 4 Jun 2009 | European Parliament election, 2009 (United Kingdom) Results | 15,136,932 | 27.7% | 16.5% | 15.7% | 13.7% | 25.6% | 11.2 pts over UKIP |
Scottish polls
| Date(s) conducted | Polling organisation/client | Sample size | SNP | Lab | Con | Lib Dem | UKIP | Others | Lead |
|---|---|---|---|---|---|---|---|---|---|
| 22 May 2014 | European Parliament election, 2014 (Scotland) Results | 1,343,483 | 29.0% (2) | 25.9% (2) | 17.2% (1) | 7.1% | 10.5% (1) | 10.4% | 3.1 pts over Lab |
| 12–15 May 2014 | ICM/Scotsman | 1,003 | 36% (3) | 27% (2) | 13% (1) | 7% | 9% | 8% | 9 pts over Lab |
| 9–12 May 2014 | Survation/Daily Record | 1,003 | 37% (3) | 26% (2) | 13% (1) | 6% | 11% | 7% | 11 pts over Lab |
| 11–22 Apr 2014 | YouGov/Edinburgh University | 1,014 | 33% (3) | 31% (2) | 12% (1) | 7% | 10% | 7% | 2 pts over Lab |
| 14–16 Apr 2014 | ICM/Scotland on Sunday | 1,004 | 37% (3) | 28% (2) | 11% (1) | 7% | 10% | 6% | 9 pts over Lab |
| 4–7 Apr 2014 | Survation/Daily Record | 1,002 | 39% (3) | 30% (2) | 14% (1) | 6% | 7% | 5% | 9 pts over Lab |
| 17–21 Mar 2014 | ICM/Scotsman | 1,010 | 41% (3) | 29% (2) | 13% (1) | 5% | 6% | 6% | 12 pts over Lab |
| 21–24 Jan 2014 | ICM/Scotsman | 1,010 | 43% (3) | 24% (2) | 14% (1) | 6% | 7% | 6% | 19 pts over Lab |
| 4 Jun 2009 | European Parliament election, 2009 (Scotland) Results | 1,104,512 | 29.1% (2) | 20.8% (2) | 16.8% (1) | 11.5% (1) | 5.2% | 16.6% | 8.2 pts over Lab |
Welsh polls
| Date(s) conducted | Polling organisation/client | Sample size | Con | Lab | Plaid | UKIP | Lib Dem | Others | Lead |
|---|---|---|---|---|---|---|---|---|---|
| 22 May 2014 | European Parliament election, 2014 (Wales) Results | 733,060 | 17.43% (1) | 28.15% (1) | 15.26% (1) | 27.55% (1) | 3.95% | 7.66% | 0.6 pt over UKIP |
| 12–14 May 2014 | YouGov/ITV | 1,092 | 16% (1) | 33% (2) | 15% | 23% (1) | 7% | 7% | 10 pts over UKIP |
| 11–22 Apr 2014 | YouGov/Cardiff University, Edinburgh University, IPPR | 1,027 | 18% (1) | 39% (2) | 11% | 20% (1) | 7% | 6% | 19 pts over UKIP |
| 10–12 Feb 2014 | YouGov/ITV | 1,250 | 17% (1) | 39% (2) | 12% | 18% (1) | 7% | 7% | 21 pts over UKIP |
| 2–4 Dec 2013 | YouGov/ITV | 1,001 | 20% (1) | 41% (3) | 13% | 13% | 8% | 5% | 21 pts over Con |
| 4 Jun 2009 | European Parliament election, 2009 (Wales) Results | 684,520 | 21.2% (1) | 20.3% (1) | 18.5% (1) | 12.8% (1) | 10.7% | 16.6% | 1 pt over Lab |
London polls
| Date(s) conducted | Polling organisation/client | Sample size | Con | Lab | Lib Dem | Green | UKIP | Others | Lead |
|---|---|---|---|---|---|---|---|---|---|
| 22 May 2014 | European Parliament election, 2014 (London) Results | 2,200,475 | 22.52% (2) | 36.67% (4) | 6.73% | 8.93% (1) | 16.87% (1) | 8.28% | 14.15 pts over Con |
| 6–8 May 2014 | YouGov/Evening Standard | 1,422 | 23% (2) | 37% (4) | 9% | 7% | 21% (2) | 3% | 14 pts over Con |
| 28–29 Apr 2014 | Survation | 1,001 | 21% (2) | 39% (3) | 13% (1) | 7% | 20% (2) | 1% | 18 pts over Con |
| 7–9 Apr 2014 | YouGov/Evening Standard | 1,209 | 25% (2) | 33% (3) | 11% (1) | 5% | 24% (2) | 3% | 8 pts over Con |
| 8-10 Oct 2013 | YouGov/Evening Standard | 1,231 | 23% | 34% | 10% | 9% | 22% | 1% | 11 pts over Con |
| 4 Jun 2009 | European Parliament election, 2009 (London) Results | 1,751,026 | 27.4% (3) | 21.3% (2) | 13.7% (1) | 10.9% (1) | 10.8% (1) | 15.9% | 6.1 pts over Lab |
See also
- List of political parties in the United Kingdom
- Members of the European Parliament for the United Kingdom 2014–19
- Opinion polling for the next United Kingdom general election
- Proposed referendum on United Kingdom membership of the European Union
- Newark by-election, 2014
- United Kingdom general election, 2015
References
- ↑ "Results of the 2014 European elections - Results by country - United Kingdom - European Parliament". Europarl.europa.eu. Retrieved 2016-07-11.
- ↑ including 1 UCUNF
- ↑ "EU reschedules elections to boost turnout". Upi.com. 2013-03-11. Retrieved 2013-05-03.
- ↑ "EU elections: Polling day will stay on Thursday, insists government". BBC. 13 March 2013. Retrieved 3 August 2013.
- ↑ "Wards and Election Information". Elmbridge.gov.uk. Retrieved 2013-04-19.
- ↑ "Brexit: What will happen to Britain's MEPs?". Retrieved 2016-06-24.
- ↑ "Ukip and Front National lead populist earthquake". Financial Times. 26 May 2014. Retrieved 2014-05-31.
- ↑ "European Elections: UKIP Tops British Polls". Sky News. 26 May 2014. Retrieved 2014-05-31.
- ↑ "UK's Eurosceptic UKIP party storms to victory in Europe vote". Reuters. 26 May 2014. Retrieved 2014-05-31.
- ↑ "10 key lessons from the European election results". The Guardian. 26 May 2014. Retrieved 2014-05-31.
- ↑ "Lurching Right: UKIP Win Creates Pressure for Cameron and Europe". Der Spiegel. 27 May 2014. Retrieved 2014-05-31.
- ↑ "European elections 2009: Gordon Brown on the edge as Labour is humiliated by BNP". The Daily Telegraph. 8 June 2009. Retrieved 2014-05-26.
- ↑ Billy Kenber (18 December 2014). "Ukip matched spending by Tories on EU elections". The Times. Retrieved 18 December 2014.
- 1 2 "UK European election results". BBC News. 26 May 2014.
- ↑ "Vote 2014: Northern Ireland European election count". BBC News. 26 May 2014.
- ↑ Paul Owen. "Former leader of Tory MEPs Edward MacMillan-Scott joins Lib Dems | Politics". The Guardian. Retrieved 2013-09-29.
- ↑ "UKIP MEP Campbell Bannerman defects to Conservatives". BBC News. 2011-05-24. Retrieved 2013-09-29.
- ↑ James Tapsfield (2013-02-23). "Ukip MEP Marta Andreasen defects to the Tories and launches attack on Nigel Farage – UK Politics – UK". London: The Independent. Retrieved 2013-09-29.
- ↑ "Mike Nattrass". Europarl.europa.eu. Retrieved 2014-04-11.
- ↑ Robin Brant (2013-09-24). "BBC News – Godfrey Bloom quits as UKIP MEP after 'sluts' joke row". Bbc.co.uk. Retrieved 2013-10-14.
- ↑ Jason Groves (2011-12-02). "Woman MEP Anthea McIntyre takes post despite not a single vote". London: Dailymail.co.uk. Retrieved 2013-05-03.
- ↑ "Order in Council". Legislation.gov. Retrieved 22 August 2013.
- 1 2 3 4 "Would you like to be a Tory MEP? There could be nine vacancies in 2014... Tory MPs". Conservativehome.blogs.com. 2012-05-23. Retrieved 2013-05-03.
- ↑ Michael Cashman CBE MEP. "West Mids Michael Cashman MEP to stand down in 2014 | Michael Cashman CBE MEP". Michael-cashman.eu. Retrieved 2013-04-19.
- ↑ "Hughes to leave Europe at next election | IWC2". Labour North. Retrieved 2013-04-19.
- ↑ "dear member". us2.forward-to-friend.com. Retrieved 3 August 2013.
- ↑ "Passing on the baton". PeterSkinnerMEP.eu. Retrieved 9 October 2013.
- ↑ "MEP Diana Wallis criticised over resignation 'nepotism'". Bbc.co.uk. 2012-01-19. Retrieved 2013-05-03.
- ↑ "Lib Dem MEP Liz Lynne to stand down". Bbc.co.uk. 2011-11-06. Retrieved 2013-05-03.
- ↑ Jill Treanor (9 October 2012). "Lib Dem MEP Sharon Bowles applies for Bank of England governor job". London: Guardian. Retrieved 2013-05-03.
- ↑ "UKIP MEP for Wales John Bufton to stand down at election". Bbc.co.uk. 2013-05-24. Retrieved 2013-06-12.
- ↑ "East Midlands UKIP MEP to stand down next June". BBC News. 3 June 2013. Retrieved 2013-06-03.
- ↑ "Godfrey Bloom quits as UKIP MEP after 'sluts' joke row". BBC News. 24 September 2013. Retrieved 2013-10-09.
- ↑ "Ukip's Godfrey Bloom to sit as independent MEP after "sluts" row". Mirror. Retrieved 2013-10-09.
- ↑ "Nick Clegg Challenges Nigel Farage To Head-To-Head EU Debate". Huffington Post. Retrieved 2014-02-21.
- ↑ "Clegg Challenges Farage To In/Out EU Debate On LBC". LBC 97.3. Retrieved 2014-02-21.
- ↑ "Nick Clegg challenges Nigel Farage to live debate on Britain's EU membership". Guardian Online. Retrieved 2014-02-21.
- ↑ Dominiczak, Peter (21 February 2014). "Nigel Farage agrees to EU debate with Nick Clegg". London: Daily Telegraph. Retrieved 2014-02-21.
- ↑ "Nick Clegg clashes with Nigel Farage in EU debate". BBC News. 26 March 2014.
- ↑ "BBC News – Nick Clegg and Nigel Farage in heated BBC debate over EU". Bbc.co.uk. 2014-04-03. Retrieved 2014-04-11.
- ↑ "EU election: Tory, Labour, UKIP and Lib Dem on Europe". BBC News. 2014-04-13. Retrieved 2014-04-17.
- ↑ "EU referendum: Tory, Labour, UKIP and Lib Dem policy". BBC News. 2014-04-13. Retrieved 2014-04-17.
- ↑ Kellner, Peter (15 January 2013). "Measuring UKIP's support". yougov.
External links
| 1979 | |
|---|---|
| 1984 | |
| 1989 | |
| 1994 | |
| 1999 | |
| 2004 | |
| 2009 | |
| 2014 | |
| 2019 |
|
| Off-year | |
| General elections |
|
|---|---|
| Local elections |
|
| European elections | |
| Referendums | |
| |