GIS file formats
A GIS file format is a standard of encoding geographical information into a computer file. They are created mainly by government mapping agencies (such as the USGS or National Geospatial-Intelligence Agency) or by GIS software developers.
Raster
A raster data type is, in essence, any type of digital image represented by reducible and enlargeable grids. Anyone who is familiar with digital photography will recognize the Raster graphics pixel as the smallest individual grid unit building block of an image, usually not readily identified as an artifact shape until an image is produced on a very large scale. A combination of the pixels making up an image color formation scheme will compose details of an image, as is distinct from the commonly used points, lines, and polygon area location symbols of scalable vector graphics as the basis of the vector model of area attribute rendering. While a digital image is concerned with its output blending together its grid based details as an identifiable representation of reality, in a photograph or art image transferred into a computer, the raster data type will reflect a digitized abstraction of reality dealt with by grid populating tones or objects, quantities, cojoined or open boundaries, and map relief schemas. Aerial photos are one commonly used form of raster data, with one primary purpose in mind: to display a detailed image on a map area, or for the purposes of rendering its identifiable objects by digitization. Additional raster data sets used by a GIS will contain information regarding elevation, a digital elevation model, or reflectance of a particular wavelength of light, Landsat, or other electromagnetic spectrum indicators.

Raster data type consists of rows and columns of cells, with each cell storing a single value. Raster data can be images raster images) with each pixel (or cell) containing a color value. Additional values recorded for each cell may be a discrete value, such as land use, a continuous value, such as temperature, or a null value if no data is available. While a raster cell stores a single value, it can be extended by using raster bands to represent RGB (red, green, blue) colors, colormaps (a mapping between a thematic code and RGB value), or an extended attribute table with one row for each unique cell value. The resolution of the raster data set is its cell width in ground units.
Raster data is stored in various formats; from a standard file-based structure of TIFF, JPEG, etc. to binary large object (BLOB) data stored directly in a relational database management system (RDBMS) similar to other vector-based feature classes. Database storage, when properly indexed, typically allows for quicker retrieval of the raster data but can require storage of millions of significantly sized records.
Vector
In a GIS, geographical features are often expressed as vectors, by considering those features as geometrical shapes. Different geographical features are expressed by different types of geometry:
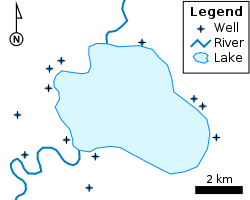
- Zero-dimensional points are used for geographical features that can best be expressed by a single point reference—in other words, by simple location. Examples include wells, peaks, features of interest, and trailheads. Points convey the least amount of information of these file types. Points can also be used to represent areas when displayed at a small scale. For example, cities on a map of the world might be represented by points rather than polygons. No measurements are possible with point features.
- Lines or polylines
- One-dimensional lines or polylines are used for linear features such as rivers, roads, railroads, trails, and topographic lines. Again, as with point features, linear features displayed at a small scale will be represented as linear features rather than as a polygon. Line features can measure distance.
- Two-dimensional polygons are used for geographical features that cover a particular area of the earth's surface. Such features may include lakes, park boundaries, buildings, city boundaries, or land uses. Polygons convey the most amount of information of the file types. Polygon features can measure perimeter and area.
Each of these geometries are linked to a row in a database that describes their attributes. For example, a database that describes lakes may contain a lake's depth, water quality, pollution level. This information can be used to make a map to describe a particular attribute of the dataset. For example, lakes could be coloured depending on level of pollution. Different geometries can also be compared. For example, the GIS could be used to identify all wells (point geometry) that are within one kilometre of a lake (polygon geometry) that has a high level of pollution.
Vector features can be made to respect spatial integrity through the application of topology rules such as 'polygons must not overlap'. Vector data can also be used to represent continuously varying phenomena. Contour lines and triangulated irregular networks (TIN) are used to represent elevation or other continuously changing values. TINs record values at point locations, which are connected by lines to form an irregular mesh of triangles. The face of the triangles represent the terrain surface.
Advantages and disadvantages
There are some important advantages and disadvantages to using a raster or vector data model to represent reality:
- Raster datasets record a value for all points in the area covered which may require more storage space than representing data in a vector format that can store data only where needed.
- Raster data is computationally less expensive to render than vector graphics
- There are transparency and aliasing problems when overlaying multiple stacked pieces of raster images
- Vector data allows for visually smooth and easy implementation of overlay operations, especially in terms of graphics and shape-driven information like maps, routes and custom fonts, which are more difficult with raster data.
- Vector data can be displayed as vector graphics used on traditional maps, whereas raster data will appear as an image that may have a blocky appearance for object boundaries. (depending on the resolution of the raster file)
- Vector data can be easier to register, scale, and re-project, which can simplify combining vector layers from different sources.
- Vector data is more compatible with relational database environments, where they can be part of a relational table as a normal column and processed using a multitude of operators.
- Vector file sizes are usually smaller than raster data, which can be tens, hundreds or more times larger than vector data (depending on resolution).
- Vector data is simpler to update and maintain, whereas a raster image will have to be completely reproduced. (Example: a new road is added).
- Vector data allows much more analysis capability, especially for "networks" such as roads, power, rail, telecommunications, etc. (Examples: Best route, largest port, airfields connected to two-lane highways). Raster data will not have all the characteristics of the features it displays.
Non-spatial data
Additional non-spatial data can also be stored along with the spatial data represented by the coordinates of a vector geometry or the position of a raster cell. In vector data, the additional data contains attributes of the feature. For example, a forest inventory polygon may also have an identifier value and information about tree species. In raster data the cell value can store attribute information, but it can also be used as an identifier that can relate to records in another table.
Software is currently being developed to support spatial and non-spatial decision-making, with the solutions to spatial problems being integrated with solutions to non-spatial problems. The end result with these flexible spatial decision-making support systems (FSDSSs)[1] is expected to be that non-experts will be able to use GIS, along with spatial criteria, and simply integrate their non-spatial criteria to view solutions to multi-criteria problems. This system is intended to assist decision-making.
Popular GIS file formats
Raster formats
- ADRG – National Geospatial-Intelligence Agency (NGA)'s ARC Digitized Raster Graphics[2]
- Binary file – An unformatted file consisting of raster data written in one of several data types, where multiple band are stored in BSQ (band sequential), BIP (band interleaved by pixel) or BIL (band interleaved by line). Georeferencing and other metadata are stored one or more sidecar files.[3]
- Digital raster graphic (DRG) – digital scan of a paper USGS topographic map
- ECRG – National Geospatial-Intelligence Agency (NGA)'s Enhanced Compressed ARC Raster Graphics (Better resolution than CADRG and no color loss)
- ECW – Enhanced Compressed Wavelet (from ERDAS). A compressed wavelet format, often lossy.
- Esri grid – proprietary binary and metadataless ASCII raster formats used by Esri
- GeoTIFF – TIFF variant enriched with GIS relevant metadata
- IMG – ERDAS IMAGINE image file format
- JPEG2000 – Open-source raster format. A compressed format, allows both lossy and lossless compression.
- MrSID – Multi-Resolution Seamless Image Database (by Lizardtech). A compressed wavelet format, allows both lossy and lossless compression.
- netCDF-CF – netCDF file format with CF medata conventions for earth science data. Binary storage in open format with optional compression. Allows for direct web-access of subsets/aggregations of maps through OPeNDAP protocol.
- RPF – Raster Product Format, military file format specified in MIL-STD-2411[4]
Vector formats
- AutoCAD DXF – contour elevation plots in AutoCAD DXF format (by Autodesk)
- Cartesian coordinate system (XYZ) – simple point cloud
- Digital line graph (DLG) – a USGS format for vector data
- Esri TIN - proprietary binary format for triangulated irregular network data used by Esri
- Geography Markup Language (GML) – XML based open standard (by OpenGIS) for GIS data exchange
- GeoJSON – a lightweight format based on JSON, used by many open source GIS packages
- GeoMedia – Intergraph's Microsoft Access based format for spatial vector storage
- ISFC – Intergraph's MicroStation based CAD solution attaching vector elements to a relational Microsoft Access database
- Keyhole Markup Language (KML) – XML based open standard (by OpenGIS) for GIS data exchange
- MapInfo TAB format – MapInfo's vector data format using TAB, DAT, ID and MAP files
- National Transfer Format (NTF) – National Transfer Format (mostly used by the UK Ordnance Survey)
- Spatialite – is a spatial extension to SQLite, providing vector geodatabase functionality. It is similar to PostGIS, Oracle Spatial, and SQL Server with spatial extensions
- Shapefile – a popular vector data GIS format, developed by Esri
- Simple Features – Open Geospatial Consortium specification for vector data
- SOSI – a spatial data format used for all public exchange of spatial data in Norway
- Spatial Data File – Autodesk's high-performance geodatabase format, native to MapGuide
- TIGER – Topologically Integrated Geographic Encoding and Referencing
- Vector Product Format (VPF) – National Geospatial-Intelligence Agency (NGA)'s format of vectored data for large geographic databases
Grid formats (for elevation)
- USGS DEM – The USGS' Digital Elevation Model
- GTOPO30 – Large complete Earth elevation model at 30 arc seconds, delivered in the USGS DEM format
- DTED – National Geospatial-Intelligence Agency (NGA)'s Digital Terrain Elevation Data, the military standard for elevation data
- GeoTIFF – TIFF variant enriched with GIS relevant metadata
- SDTS – The USGS' successor to DEM
Other formats
- Dual Independent Map Encoding (DIME) – A historic GIS file format, developed in the 1960s
- Geographic Data Files (GDF) — An interchange file format for geographic data
- GeoPackage (GPKG) – An standards-based open format based on the SQLite database format for both vector and raster data
- Well-known text (WKT) – A text markup language for representing feature geometry, developed by Open Geospatial Consortium
- Well-known binary (WKB) – Binary version of Well-known text
- World file – Georeferencing a raster image file (e.g. JPEG, BMP)
See also
- Datum (geodesy)
- GDAL/OGR, a library for reading and writing many formats
- Geography portal
References
- ↑ Gao, Shan. Paynter, John. & David Sundaram, (2004) "Flexible Support for Spatial Decision-Making" Proc. of the 37th Hawaii International Conference on System Sciences 5–8 pp. 10
- ↑ "Arc Digitized Raster Graphic (ADRG)". Digital Preservation. Library of Congress. 2011-09-25. Retrieved 2014-03-13.
- ↑ Template:Cite web title=Various Supported GDAL Raster Formats
- ↑ "Raster Product Format". Digital Preservation. Library of Congress. 2011-10-27. Retrieved 2014-03-13.