Lower Saxony state election, 2013
| | ||||||||||||||||||||||||||||||||||||||||||||||||||||||||||||||||||||||||||||||||||||||||||||
| ||||||||||||||||||||||||||||||||||||||||||||||||||||||||||||||||||||||||||||||||||||||||||||
| ||||||||||||||||||||||||||||||||||||||||||||||||||||||||||||||||||||||||||||||||||||||||||||
|
| ||||||||||||||||||||||||||||||||||||||||||||||||||||||||||||||||||||||||||||||||||||||||||||
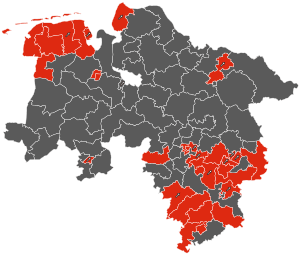
| First votes winners in the electoral districts | ||||||||||||||||||||||||||||||||||||||||||||||||||||||||||||||||||||||||||||||||||||||||||||
| ||||||||||||||||||||||||||||||||||||||||||||||||||||||||||||||||||||||||||||||||||||||||||||


A state election was held in Lower Saxony on 20 January 2013 to elect the 137 members of the Landtag.
The CDU-led government of Minister-President David McAllister sought to retain power in the assembly, but fell one seat short of a majority. They were replaced by an SPD-Green coalition, which has a one-seat majority.[2]
Background
In the regional elections on 27 January 2008, the CDU-FDP coalition was reelected under Prime Minister Christian Wulff. The SPD under Wolfgang Jüttner lost more than three percentage points to make it the SPD's worst ever result in Lower Saxony. The FDP retained their status as the third strongest party over the Greens although only by 0.2% of the vote. The Left achieved 7.1 percent of the vote, crossing the minimum electoral threshold and earning representation for the first time in the state legislature. Before the election the SPD & Greens announced their plan to govern together and campaign together. The CDU acted independently of the FDP during the campaign but sought to continue the CDU-FDP coalition after the election. If a CDU-FDP coalition was unable to be formed, the CDU said the SPD would be their second choice; however the SPD itself rejected the idea of a grand coalition with the CDU. The Left and The Pirates remained outside of possible coalition talks and failed to win seats in the election.[2]
Polls
| Pollster | Date | CDU | SPD | FDP | Greens | The Left | Pirates | Others |
|---|---|---|---|---|---|---|---|---|
| Exit Poll | 20.01.2013 | 36.8% | 32.9% | 9.6% | 13.5% | <5 % | <5 % | <5 % |
| GMS | 17.01.2013 | 41% | 33% | 5% | 13% | 3% | 3% | 2% |
| INFO GmbH | 12.01.2013 | 38% | 31.5% | 4.5% | 14.5% | 6% | 3% | 2.5% |
| Infratest dimap | 10.01.2013 | 40% | 33% | 5% | 13% | 3% | 3% | 3% |
| GMS | 10.01.2013 | 41% | 33% | 5% | 13% | 3% | 3% | 2% |
| Forschungsgruppe Wahlen | 10.01.2013 | 39% | 33% | 5% | 13% | 3% | 3% | 4% |
| Infratest dimap | 03.01.2013 | 40% | 34% | 4% | 13% | 3% | 3% | 3% |
| INFO GmbH | 22.12.2012 | 38.5% | 33% | 3.5% | 12.5% | 4% | 4.5% | – |
| Forschungsgruppe Wahlen | 06.12.2012 | 39% | 32% | 4% | 13% | 4% | 4% | 4% |
| Infratest dimap | 06.12.2012 | 40% | 33% | 3% | 15% | 3% | 3% | 3% |
| GMS | 04.12.2012 | 41% | 32% | 4% | 13% | 3% | 4% | 3% |
| Infratest dimap | 08.11.2012 | 41% | 34% | 3% | 13% | 3% | 3% | 3% |
| Infratest dimap | 20.09.2012 | 37% | 33% | 3% | 15% | 4% | 4% | 4% |
| GMS | 20.09.2012 | 38% | 33% | 5% | 13% | 5% | 3% | 3% |
| Forsa[3] | 24.07.2012 | 38% | 33% | 4% | 11% | 4% | 7% | 3% |
| YouGov | 19.07.2012 | 31% | 35% | 4% | 14% | 5% | 7% | 4% |
| Infratest dimap[4] | 16.05.2012 | 32% | 36% | 4% | 13% | 3% | 8% | 4% |
| GMS[5] | 16.05.2012 | 37% | 33% | 3% | 13% | 3% | 9% | 2% |
| Infratest dimap[6] | 25.01.2012 | 36% | 32% | 3% | 17% | 5% | 4% | 3% |
| GMS[7] | 20.01.2012 | 37% | 33% | 3% | 18% | 3% | 3% | 3% |
Results

< 2008 ![]() Next >
Next >
| Party | Popular vote | Seats | ||||||||
|---|---|---|---|---|---|---|---|---|---|---|
| Votes | % | +/– | Seats | +/– | ||||||
| Christian Democratic Union Christlich Demokratische Union Deutschlands - CDU | 1,287,730 | 36.0% | -6.5% | 54 | -14 | |||||
| Social Democratic Party of Germany Sozialdemokratische Partei Deutschlands - SPD | 1,165,538 | 32.6% | +2.3% | 49 | +1 | |||||
| Alliance '90/The Greens Bündnis 90/Die Grünen | 489,572 | 13.7% | +5.7 % | 20 | +8 | |||||
| Free Democratic Party Freie Demokratische Partei – FDP | 354,971 | 9.9% | +1.7% | 14 | +1 | |||||
| Left Die Linke | 112,215 | 3.1% | -4.0% | 0 | -11 | |||||
| Other parties | 165,235 | 4.7% | +0.8% | | | |||||
| Valid votes | 3,575,261 | 98.7% | |
|||||||
| Invalid votes | 45,733 | 1.3% | | |||||||
| Totals and voter turnout | 3,620,994 | 59.4% | |
137 | | |||||
| Electorate | 6,100,218 | 100.00 | — | |||||||
| Source: Landeswahlleiterin Niedersachsen | ||||||||||
Most polls taken in early 2012 showed a SPD-Green majority. However, in the run up to the election, polls tightened with the CDU-FDP coalition virtually neck and neck with the SPD-Green coalition. Polling suggested that the FDP's vote could be very close to 5%, which led to some officials in the CDU to suggest tactically voting FDP to ensure it met the minimum threshold, thus ensuring the continuation of the CDU-FDP.[2]
Sources
- ↑ Donahue, Patrick (9 January 2013). "Merkel's Party Climbs in Poll as FDP Coalition Partner Plunges". Bloomberg. Retrieved 9 January 2013.
- 1 2 3 The vincible chancellor, The Economist, 26 January 2013
- ↑ Umfrage: CDU stärkste Kraft in Niedersachsen
- ↑ Wahlumfragen im Auftrag des NDR
- ↑ Wahlumfragen zur Landtagswahl im Niedersachsen.
- ↑ Wahlumfragen zur Landtagswahl im Niedersachsen
- ↑ Die politische Stimmung in Niedersachsen April 2012