Norwegian parliamentary election, 1997
Norwegian Parliamentary election, 1997
|
|
|
|
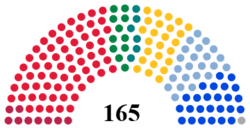
All 165 seats to the Norwegian Parliament
83 seats were needed for a majority |
| |
First party |
Second party |
Third party |
| |
 |
 |
 |
| Leader |
Thorbjørn Jagland |
Carl I. Hagen |
Valgerd Svarstad Haugland |
| Party |
Labour |
Progress |
Christian Democratic |
| Last election |
67 seats, 36.9% |
10 seats, 6.3% |
13 seats, 7.9% |
| Seats won |
65 |
25 |
25 |
| Seat change |
 2 2 |
 15 15 |
12 |
| Popular vote |
904,362 |
395,376 |
353,082 |
| Percentage |
35.0% |
15.3% |
13.7% |
|
| |
Fourth party |
Fifth party |
Sixth party |
| |
 |
 |
 |
| Leader |
Jan Petersen |
Anne Enger Lahnstein |
Erik Solheim |
| Party |
Conservative |
Centre |
Socialist Left |
| Last election |
28 seats, 17.0% |
32 seats, 16.7% |
13 seats, 7.9% |
| Seats won |
23 |
11 |
9 |
| Seat change |
5 |
21 |
4 |
| Popular vote |
370,441 |
204,824 |
155,307 |
| Percentage |
14.3% |
7.9% |
6.0% |
|
| |
Seventh party |
|
| |
 |
|
| Leader |
Lars Sponheim |
|
| Party |
Liberal |
|
| Last election |
1 seat, 3.6% |
|
| Seats won |
6 |
|
| Seat change |
5 |
|
| Popular vote |
115,077 |
|
| Percentage |
4.5% |
|
|
|
|
Parliamentary elections were held in Norway on 14 and 15 September 1997.[1] Prior to the election Prime Minister Thorbjørn Jagland of the Labour Party had issued the 36.9 ultimatum declaring that the government would step down unless it gained 36.9% of the vote, the percentage gained by the Labour Party in 1993 under Gro Harlem Brundtland. Whilst Labour won a plurality of seats, they were unable to reach Jagland's 36.9% threshold, gaining 35% of the vote. As a result of this, the Labour government stepped down, being replaced by a centrist coalition of the Christian People's Party, Liberal Party and the Centre Party, with Kjell Magne Bondevik being appointed Prime Minister, and confidence and supply support from the Progress Party and Conservative Party.
Results
 |
|---|
| Party |
Votes |
% |
Seats |
+/– |
| Labour Party | 904,362 | 35.0 | 65 | –2 |
| Progress Party | 395,376 | 15.3 | 25 | +15 |
| Conservative Party | 370,441 | 14.3 | 23 | –5 |
| Christian People's Party | 353,082 | 13.7 | 25 | +12 |
| Centre Party | 204,824 | 7.9 | 11 | –21 |
| Socialist Left Party | 155,307 | 6.0 | 9 | –4 |
| Liberal Party | 115,077 | 4.5 | 6 | +5 |
| Red Electoral Alliance | 43,252 | 1.7 | 0 | –1 |
| Pensioners' Party | 16,031 | 0.6 | 0 | 0 |
| Non-Partisan Deputies | 9,195 | 0.4 | 1 | +1 |
| Environment Party The Greens | 5,884 | 0.2 | 0 | 0 |
| Fatherland Party | 3,805 | 0.2 | 0 | 0 |
| Natural Law Party | 2,207 | 0.1 | 0 | 0 |
| Communist Party | 1,979 | 0.1 | 0 | 0 |
| Christian Conservative Party | 1,386 | 0.1 | 0 | 0 |
| New Future Coalition Party | 491 | 0.0 | 0 | 0 |
| White Electoral Alliance | 463 | 0.0 | 0 | New |
| Justice Party | 281 | 0.0 | 0 | New |
| Liberal People's Party | 258 | 0.0 | 0 | 0 |
| Children-Elderly | 246 | 0.0 | 0 | New |
| Society Party | 214 | 0.0 | 0 | 0 |
| Invalid/blank votes | 9,508 | – | – | – |
| Total | 2,593,669 | 100 | 165 | 0 |
| Registered voters/turnout | 3,311,190 | 78.3 | – | – |
| Source: Nohlen & Stöver, European Elections Database |
References
- ↑ Nohlen, D & Stöver, P (2010) Elections in Europe: A data handbook, p1438 ISBN 978-3-8329-5609-7