Sainte-Marie-Madeleine, Quebec
| Sainte-Marie-Madeleine | |
|---|---|
| Parish municipality | |
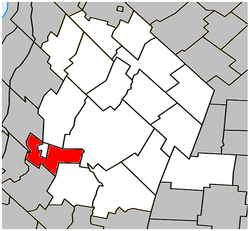 Location within Les Maskoutains RCM. | |
 Sainte-Marie-Madeleine Location in southern Quebec. | |
| Coordinates: 45°36′N 73°06′W / 45.600°N 73.100°WCoordinates: 45°36′N 73°06′W / 45.600°N 73.100°W[1] | |
| Country |
|
| Province |
|
| Region | Montérégie |
| RCM | Les Maskoutains |
| Constituted | August 13, 1879 |
| Government[2][3] | |
| • Mayor | Simon Lacombe |
| • Federal riding | Saint-Hyacinthe—Bagot |
| • Prov. riding | Borduas |
| Area[2][4] | |
| • Total | 49.80 km2 (19.23 sq mi) |
| • Land | 50.87 km2 (19.64 sq mi) |
|
There is an apparent contradiction between two authoritative sources | |
| Population (2011)[4] | |
| • Total | 2,935 |
| • Density | 57.7/km2 (149/sq mi) |
| • Pop 2006-2011 |
|
| • Dwellings | 1,141 |
| Time zone | EST (UTC−5) |
| • Summer (DST) | EDT (UTC−4) |
| Postal code(s) | J0H 1S0 |
| Area code(s) | 450 and 579 |
| Highways |
|
| Website |
www -madeleine |
Sainte-Marie-Madeleine is a parish municipality in southwestern Quebec, Canada, in Les Maskoutains Regional County Municipality. The population as of the Canada 2011 Census was 2,935.
Demographics
Population
| Canada census – Sainte-Marie-Madeleine, Quebec community profile | |||
|---|---|---|---|
| 2011 | 2006 | 2001 | |
| Population: | 2,935 (+9.6% from 2006) | 2,678 (+8.6% from 2001) | 2,466 (+9.0% from 1996) |
| Land area: | 50.87 km2 (19.64 sq mi) | 50.87 km2 (19.64 sq mi) | 50.87 km2 (19.64 sq mi) |
| Population density: | 57.7/km2 (149/sq mi) | 52.6/km2 (136/sq mi) | 48.5/km2 (126/sq mi) |
| Median age: | 38.3 (M: 38.1, F: 39.0) | 38.5 (M: 38.2, F: 38.9) | 36.5 (M: 36.6, F: 36.4) |
| Total private dwellings: | 1,141 | 1,039 | 905 |
| Median household income: | $62,152 | $54,593 | $46,161 |
| References: 2011[4] 2006[5] 2001[6] | |||
| Historical Census Data - Sainte-Marie-Madeleine, Quebec[7] | ||||||||||||||||||||||||||
|---|---|---|---|---|---|---|---|---|---|---|---|---|---|---|---|---|---|---|---|---|---|---|---|---|---|---|
|
|
| ||||||||||||||||||||||||
Language
| Canada Census Mother Tongue - Sainte-Marie-Madeleine, Quebec[7] | ||||||||||||||||||
|---|---|---|---|---|---|---|---|---|---|---|---|---|---|---|---|---|---|---|
| Census | Total | French |
English |
French & English |
Other | |||||||||||||
| Year | Responses | Count | Trend | Pop % | Count | Trend | Pop % | Count | Trend | Pop % | Count | Trend | Pop % | |||||
| 2011 |
2,935 |
2,855 | |
97.27% | 35 | |
1.19% | 20 | |
0.68% | 25 | |
0.85% | |||||
| 2006 |
2,650 |
2,490 | |
93.96% | 50 | |
1.89% | 10 | |
0.38% | 100 | |
3.77% | |||||
| 2001 |
2,460 |
2,410 | |
97.97% | 15 | |
0.61% | 15 | |
0.61% | 20 | |
0.81% | |||||
| 1996 |
2,265 |
2,180 | n/a | 96.25% | 55 | n/a | 2.43% | 10 | n/a | 0.44% | 20 | n/a | 0.88% | |||||
See also
References
- ↑ Reference number 56329 of the Commission de toponymie du Québec (French)
- 1 2 Ministère des Affaires municipales, des Régions et de l'Occupation du territoire: Sainte-Marie-Madeleine
- ↑ Parliament of Canada Federal Riding History: SAINT-HYACINTHE--BAGOT (Quebec)
- 1 2 3 2011 Statistics Canada Community Profile: Sainte-Marie-Madeleine, Quebec
- ↑ "2006 Community Profiles". Canada 2006 Census. Statistics Canada. March 30, 2011. Retrieved 2014-03-25.
- ↑ "2001 Community Profiles". Canada 2001 Census. Statistics Canada. February 17, 2012. Retrieved 2014-03-25.
- 1 2 Statistics Canada: 1996, 2001, 2006, 2011 census
 |
Saint-Charles-sur-Richelieu | Sainte-Madeleine / La Présentation | | |
| Mont-Saint-Hilaire | |
Saint-Hyacinthe | ||
| ||||
| | ||||
| Saint-Jean-Baptiste | Saint-Damase |
| Cities | |
|---|---|
| Municipalities | |
| Parishes | |
| Villages | |
| |
This article is issued from Wikipedia - version of the 11/8/2014. The text is available under the Creative Commons Attribution/Share Alike but additional terms may apply for the media files.