Sheffield City Council election, 1996
| | |||||||||||||||||||||||||||||||
| |||||||||||||||||||||||||||||||
| |||||||||||||||||||||||||||||||
|
| |||||||||||||||||||||||||||||||
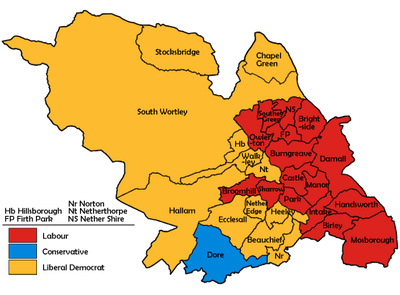
| Map showing the results of the 1996 Sheffield City Council elections. | |||||||||||||||||||||||||||||||
| |||||||||||||||||||||||||||||||
Elections to Sheffield City Council were held on 3 May 1996. One third of the council was up for election.
Election result
| Sheffield Local Election Result 1996 | ||||||||||
|---|---|---|---|---|---|---|---|---|---|---|
| Party | Seats | Gains | Losses | Net gain/loss | Seats % | Votes % | Votes | +/− | ||
| Labour | 17 | 1 | 4 | -3 | 56.6 | 44.2 | 52,109 | -3.2% | ||
| Liberal Democrat | 12 | 6 | 0 | +6 | 40.0 | 40.9 | 48,194 | +2.0% | ||
| Conservative | 1 | 0 | 3 | -3 | 3.3 | 13.2 | 15,610 | +1.9% | ||
| Independent Labour | 0 | 0 | 0 | 0 | 0.0 | 0.6 | 672 | -0.1% | ||
| Militant Labour | 0 | 0 | 0 | 0 | 0.0 | 0.5 | 648 | -0.1% | ||
| Green | 0 | 0 | 0 | 0 | 0.0 | 0.4 | 542 | -0.4% | ||
| Independent Conservative | 0 | 0 | 0 | 0 | 0.0 | 0.1 | 121 | +0.0% | ||
This result had the following consequences for the total number of seats on the Council after the elections:
| Party | Previous council | New council | |||
|---|---|---|---|---|---|
| Labour | 58 | 55 | |||
| Liberal Democrats | 25 | 31 | |||
| Conservatives | 4 | 1 | |||
| Total | 87 | 87 | |||
| Working majority | 29 | 23 | |||
Ward results
| Party | Candidate | Votes | % | ± | |
|---|---|---|---|---|---|
| Liberal Democrat | Roger Hughes | 3,142 | 57.3 | +2.7 | |
| Labour | Robert Pemberton | 1,555 | 28.4 | +0.2 | |
| Conservative | Frank Woodger | 785 | 14.3 | -3.0 | |
| Majority | 1,587 | 28.9 | +2.5 | ||
| Turnout | 5,482 | 37.5 | +3.1 | ||
| Liberal Democrat hold | Swing | +1.2 | |||
| Party | Candidate | Votes | % | ± | |
|---|---|---|---|---|---|
| Labour | Paul Colk | 2,337 | 61.8 | -1.8 | |
| Liberal Democrat | Michael Ogden | 973 | 25.7 | -0.1 | |
| Conservative | Laurence Hayward | 470 | 12.4 | +1.8 | |
| Majority | 1,364 | 36.1 | -1.7 | ||
| Turnout | 3,780 | 26.0 | -14.6 | ||
| Labour hold | Swing | -0.8 | |||
| Party | Candidate | Votes | % | ± | |
|---|---|---|---|---|---|
| Labour | Peter Price | 1,619 | 56.4 | +1.8 | |
| Liberal Democrat | Wayne Morton | 1,105 | 38.5 | -3.7 | |
| Conservative | Marjorie Kirby | 144 | 5.0 | +1.8 | |
| Majority | 514 | 17.9 | +5.5 | ||
| Turnout | 2,868 | 23.8 | -6.2 | ||
| Labour hold | Swing | +2.7 | |||
| Party | Candidate | Votes | % | ± | |
|---|---|---|---|---|---|
| Labour | Angela Smith | 1,915 | 45.0 | +0.2 | |
| Liberal Democrat | Janice Sidebottom | 1,366 | 32.1 | +1.8 | |
| Conservative | Derwent Levick | 970 | 22.8 | +2.1 | |
| Majority | 549 | 12.9 | -1.6 | ||
| Turnout | 4,251 | 28.2 | +0.6 | ||
| Labour gain from Conservative | Swing | -0.8 | |||
| Party | Candidate | Votes | % | ± | |
|---|---|---|---|---|---|
| Labour | Jacqueline Field | 1,457 | 55.2 | +13.9 | |
| Independent Labour | James Jamison | 672 | 25.5 | -4.6 | |
| Liberal Democrat | David Robinson | 330 | 12.5 | -9.5 | |
| Conservative | Mary Hyatt | 178 | 6.7 | +0.2 | |
| Majority | 785 | 29.7 | +18.5 | ||
| Turnout | 2,637 | 27.6 | -1.6 | ||
| Labour hold | Swing | +9.2 | |||
| Party | Candidate | Votes | % | ± | |
|---|---|---|---|---|---|
| Labour | Barney Mynott | 1,356 | 65.0 | -10.3 | |
| Liberal Democrat | Howard Middleton | 330 | 15.8 | +2.8 | |
| Militant Labour | Peter Fryer | 172 | 8.2 | +8.2 | |
| Conservative | Michael Young | 158 | 7.6 | +1.1 | |
| Green | Graham Wroe | 172 | 3.3 | -0.3 | |
| Majority | 1,026 | 49.2 | -13.1 | ||
| Turnout | 2,085 | 20.7 | -1.5 | ||
| Labour hold | Swing | -6.5 | |||
| Party | Candidate | Votes | % | ± | |
|---|---|---|---|---|---|
| Liberal Democrat | Kathleen Chadwick | 3,105 | 59.2 | +0.7 | |
| Labour | Susan Greaves | 1,899 | 36.2 | -1.8 | |
| Conservative | Michael Boot | 243 | 4.6 | +1.2 | |
| Majority | 1,206 | 23.0 | +2.5 | ||
| Turnout | 5,247 | 29.2 | -5.4 | ||
| Liberal Democrat hold | Swing | +1.2 | |||
| Party | Candidate | Votes | % | ± | |
|---|---|---|---|---|---|
| Labour | Steve Barnard | 1,916 | 59.0 | +10.9 | |
| Liberal Democrat | John Martin | 1,006 | 31.0 | -7.5 | |
| Conservative | Qari Siddique | 324 | 10.0 | +2.0 | |
| Majority | 910 | 28.0 | +18.4 | ||
| Turnout | 3,246 | 22.9 | -6.2 | ||
| Labour hold | Swing | +9.2 | |||
| Party | Candidate | Votes | % | ± | |
|---|---|---|---|---|---|
| Conservative | David Heslop | 2,913 | 45.0 | +6.7 | |
| Liberal Democrat | Gail Smith | 2,545 | 39.3 | -1.3 | |
| Labour | Richard Pearce | 1,009 | 15.6 | -5.4 | |
| Majority | 368 | 5.7 | +3.4 | ||
| Turnout | 6,467 | 42.6 | +3.3 | ||
| Conservative hold | Swing | +4.0 | |||
| Party | Candidate | Votes | % | ± | |
|---|---|---|---|---|---|
| Liberal Democrat | Kate Dawson | 3,223 | 48.4 | +2.0 | |
| Conservative | John Harthman | 2,137 | 32.1 | +3.0 | |
| Labour | Brendan Kitchen | 1,301 | 19.5 | -5.0 | |
| Majority | 1,086 | 16.3 | -1.0 | ||
| Turnout | 6,661 | 42.6 | +2.1 | ||
| Liberal Democrat gain from Conservative | Swing | -0.5 | |||
| Party | Candidate | Votes | % | ± | |
|---|---|---|---|---|---|
| Labour | Mohammed Ilyas | 1,814 | 63.3 | -3.4 | |
| Labour | Alan Law | 1,612 | |||
| Liberal Democrat | Susan Cutts | 748 | 26.1 | -0.9 | |
| Liberal Democrat | Jonathan Harston | 658 | |||
| Conservative | Khalid Mahmood | 302 | 10.5 | +4.3 | |
| Conservative | Brian Trueman | 209 | |||
| Majority | 1,066 | 37.2 | -2.5 | ||
| Turnout | 2,864 | 24.0 | -1.1 | ||
| Labour hold | Swing | ||||
| Labour hold | Swing | -1.2 | |||
| Party | Candidate | Votes | % | ± | |
|---|---|---|---|---|---|
| Liberal Democrat | John Knight | 3,199 | 52.4 | +9.1 | |
| Conservative | Charles Wallis | 1,743 | 28.5 | -1.8 | |
| Labour | Ian White | 1,164 | 19.0 | -4.6 | |
| Majority | 1,456 | 23.8 | +10.8 | ||
| Turnout | 6,106 | 41.1 | -0.6 | ||
| Liberal Democrat gain from Conservative | Swing | +5.4 | |||
| Party | Candidate | Votes | % | ± | |
|---|---|---|---|---|---|
| Labour | Michael Rooney | 2,402 | 65.2 | -1.1 | |
| Liberal Democrat | Louise Truman | 890 | 24.1 | -2.3 | |
| Conservative | Shirley Clayton | 393 | 10.6 | +3.3 | |
| Majority | 1,512 | 41.0 | +1.1 | ||
| Turnout | 3,685 | 25.7 | -6.3 | ||
| Labour hold | Swing | +0.6 | |||
| Party | Candidate | Votes | % | ± | |
|---|---|---|---|---|---|
| Liberal Democrat | Robert Watson | 2,363 | 49.9 | +3.4 | |
| Labour | David Hayes | 2,159 | 45.6 | -3.3 | |
| Conservative | Eric Smith | 215 | 4.5 | -0.1 | |
| Majority | 204 | 4.3 | +1.9 | ||
| Turnout | 4,737 | 34.7 | -0.7 | ||
| Liberal Democrat gain from Labour | Swing | +3.3 | |||
| Party | Candidate | Votes | % | ± | |
|---|---|---|---|---|---|
| Liberal Democrat | Peter Macloughlin | 2,765 | 54.9 | +6.4 | |
| Labour | Robert Harpham | 2,008 | 39.9 | -4.1 | |
| Conservative | Simon Dawson | 261 | 5.2 | -2.3 | |
| Majority | 757 | 15.0 | +10.5 | ||
| Turnout | 5,034 | 35.4 | -0.0 | ||
| Liberal Democrat gain from Labour | Swing | +5.2 | |||
| Party | Candidate | Votes | % | ± | |
|---|---|---|---|---|---|
| Labour | Janet Wilson | 1,960 | 55.9 | +5.6 | |
| Liberal Democrat | Edward Fairhurst | 1,130 | 32.2 | -12.0 | |
| Conservative | Mark Cashin | 414 | 11.8 | +6.3 | |
| Majority | 830 | 23.7 | +17.6 | ||
| Turnout | 3,504 | 24.0 | -7.7 | ||
| Labour hold | Swing | +8.8 | |||
| Party | Candidate | Votes | % | ± | |
|---|---|---|---|---|---|
| Labour | Michael Smith | 1,245 | 65.9 | -0.0 | |
| Liberal Democrat | Roy Denton | 347 | 18.3 | -1.3 | |
| Militant Labour | Alistair Tice | 163 | 8.6 | +0.4 | |
| Conservative | Andrew Watson | 135 | 7.1 | +0.9 | |
| Majority | 898 | 47.5 | +1.2 | ||
| Turnout | 1,890 | 21.4 | -5.3 | ||
| Labour hold | Swing | +0.6 | |||
| Party | Candidate | Votes | % | ± | |
|---|---|---|---|---|---|
| Labour | Dorothy Walton | 3,176 | 59.8 | -2.7 | |
| Liberal Democrat | David Caldwell | 1,205 | 22.7 | +1.0 | |
| Conservative | Brenden Doyle | 810 | 15.2 | +1.1 | |
| Independent Conservative | Colin Taylor | 121 | 2.3 | +0.7 | |
| Majority | 1,971 | 37.1 | -3.7 | ||
| Turnout | 5,312 | 20.7 | |||
| Labour hold | Swing | -1.8 | |||
| Party | Candidate | Votes | % | ± | |
|---|---|---|---|---|---|
| Liberal Democrat | Ali Qadar | 2,601 | 49.3 | +4.6 | |
| Labour | William Eldridge | 1,969 | 37.3 | -7.7 | |
| Conservative | Ian Ramsay | 446 | 8.4 | -1.9 | |
| Green | Ronald Giles | 261 | 4.9 | +4.9 | |
| Majority | 632 | 12.0 | +11.7 | ||
| Turnout | 5,277 | 40.0 | +2.4 | ||
| Liberal Democrat hold | Swing | +6.1 | |||
| Party | Candidate | Votes | % | ± | |
|---|---|---|---|---|---|
| Labour | Jane Bird | 1,696 | 60.7 | -6.7 | |
| Liberal Democrat | John Tomlinson | 922 | 33.0 | +6.8 | |
| Conservative | Margaret Piggott | 176 | 6.3 | -0.1 | |
| Majority | 774 | 27.7 | -13.5 | ||
| Turnout | 2,794 | 23.8 | -2.9 | ||
| Labour hold | Swing | -6.7 | |||
| Party | Candidate | Votes | % | ± | |
|---|---|---|---|---|---|
| Liberal Democrat | Sylvia Anginotti | 1,876 | 50.8 | +14.2 | |
| Labour | Ernest Hardy | 1,497 | 40.5 | -12.2 | |
| Green | Barry New | 212 | 5.7 | -0.5 | |
| Conservative | Andrew Cook | 109 | 2.9 | -1.5 | |
| Majority | 379 | 10.2 | -5.9 | ||
| Turnout | 3,694 | 30.2 | +0.2 | ||
| Liberal Democrat hold | Swing | +13.2 | |||
| Party | Candidate | Votes | % | ± | |
|---|---|---|---|---|---|
| Liberal Democrat | Christopher Tutt | 2,370 | 52.5 | +9.7 | |
| Labour | Grant Blackwell | 1,828 | 40.5 | -7.5 | |
| Conservative | Shirley Trueman | 314 | 6.9 | -2.3 | |
| Majority | 542 | 12.0 | +6.8 | ||
| Turnout | 4,512 | 39.0 | +1.4 | ||
| Liberal Democrat gain from Labour | Swing | +8.6 | |||
| Party | Candidate | Votes | % | ± | |
|---|---|---|---|---|---|
| Labour | David Jones | 1,588 | 60.0 | -7.4 | |
| Liberal Democrat | Markus Sova | 809 | 30.6 | +6.2 | |
| Conservative | Clive Dearden | 249 | 9.4 | +1.3 | |
| Majority | 779 | 29.4 | -13.6 | ||
| Turnout | 2,646 | 22.7 | -1.7 | ||
| Labour hold | Swing | -6.8 | |||
| Party | Candidate | Votes | % | ± | |
|---|---|---|---|---|---|
| Labour | Joan Lumley | 1,275 | 60.8 | +4.1 | |
| Liberal Democrat | Sheila Hughes | 362 | 17.3 | +1.0 | |
| Militant Labour | Ken Douglas | 313 | 14.9 | -6.6 | |
| Conservative | Michael Ginn | 146 | 7.0 | +1.5 | |
| Majority | 913 | 43.5 | +8.3 | ||
| Turnout | 2,096 | 19.4 | -2.8 | ||
| Labour hold | Swing | +1.5 | |||
| Party | Candidate | Votes | % | ± | |
|---|---|---|---|---|---|
| Labour | Michael Pye | 1,727 | 64.2 | +6.5 | |
| Liberal Democrat | Andrew White | 753 | 28.0 | -7.6 | |
| Conservative | Anne Smith | 211 | 7.8 | +1.1 | |
| Majority | 974 | 36.2 | +14.1 | ||
| Turnout | 2,691 | 21.5 | -14.4 | ||
| Labour hold | Swing | +7.0 | |||
| Party | Candidate | Votes | % | ± | |
|---|---|---|---|---|---|
| Liberal Democrat | Arthur Dunworth | 3,252 | 59.0 | +2.3 | |
| Labour | Peter Rippon | 1,631 | 29.6 | -5.7 | |
| Conservative | Thomas Pigott | 630 | 11.4 | +3.5 | |
| Majority | 1,621 | 29.4 | +8.0 | ||
| Turnout | 5,513 | 30.1 | -5.8 | ||
| Liberal Democrat hold | Swing | +4.0 | |||
| Party | Candidate | Votes | % | ± | |
|---|---|---|---|---|---|
| Labour | John Butler | 1,693 | 74.0 | -4.7 | |
| Liberal Democrat | Kathleen Key | 449 | 19.6 | +3.4 | |
| Conservative | David Marriot | 146 | 6.4 | +1.4 | |
| Majority | 1,244 | 54.4 | -8.1 | ||
| Turnout | 2,288 | 21.9 | -3.1 | ||
| Labour hold | Swing | +4.0 | |||
| Party | Candidate | Votes | % | ± | |
|---|---|---|---|---|---|
| Liberal Democrat | Maureen Brelsford | 1,636 | 56.0 | +2.3 | |
| Labour | Sylvia Parry | 1,092 | 37.4 | -3.7 | |
| Conservative | Anne Smith | 191 | 6.5 | +1.3 | |
| Majority | 544 | 18.6 | +6.0 | ||
| Turnout | 2,919 | 27.5 | -2.1 | ||
| Liberal Democrat hold | Swing | +3.0 | |||
| Party | Candidate | Votes | % | ± | |
|---|---|---|---|---|---|
| Liberal Democrat | Diane Leek | 2,734 | 53.3 | +6.9 | |
| Labour | Jean Cromar | 2,209 | 43.0 | -4.0 | |
| Conservative | Peter Smith | 188 | 3.6 | +0.1 | |
| Majority | 525 | 10.2 | +9.6 | ||
| Turnout | 5,131 | 36.9 | |||
| Liberal Democrat gain from Labour | Swing | +5.4 | |||
References
| Metropolitan boroughs |
|
|---|---|
| Unitary authorities |
|
| District councils |
|
| Ad-hoc election | |
| Barnsley Metropolitan Borough Council | |
|---|---|
| Doncaster Metropolitan Borough Council | |
| Rotherham Metropolitan Borough Council | |
| Sheffield City Council |
|
| South Yorkshire County Council |
|
| West Riding County Council | |
| |
This article is issued from Wikipedia - version of the 11/29/2016. The text is available under the Creative Commons Attribution/Share Alike but additional terms may apply for the media files.