South Australian state election, 2018
| | ||||||||||||||||||||||||||||||||||||||||||||
| ||||||||||||||||||||||||||||||||||||||||||||
| ||||||||||||||||||||||||||||||||||||||||||||
| ||||||||||||||||||||||||||||||||||||||||||||

The 2018 South Australian state election will elect members to the 54th Parliament of South Australia on 17 March 2018. All 47 seats in the House of Assembly or lower house, whose current members were elected at the 2014 election, and 11 of 22 seats in the Legislative Council or upper house, last filled at the 2010 election, will become vacant. The record-16-year-incumbent Australian Labor Party (SA) government, currently led by Premier Jay Weatherill, will seek a fifth four-year term against the opposition Liberal Party of Australia (SA), currently led by Opposition Leader Steven Marshall.
Like federal elections, South Australia has compulsory voting, uses full-preference instant-runoff voting for single-member electorates in the lower house and single transferable vote group voting tickets in the proportionally represented upper house. The election will be conducted by the Electoral Commission of South Australia (ECSA), an independent body answerable to Parliament.
2014 election outcome
The 2014 election resulted in a hung parliament with 23 seats for Labor and 22 for the Liberals. The balance of power rested with the two crossbench independents, Bob Such and Geoff Brock. Such did not indicate who he would support in a minority government before he went on medical leave for a brain tumour. University of Adelaide Professor and Political Commentator Clem McIntyre said Such's situation virtually guaranteed Brock would side with Labor. With 24 seats required to govern, Brock backed Labor, allowing Premier Jay Weatherill to remain in office at the head of a minority government. McIntyre said:[1]
If Geoff Brock had gone with the Liberals, then the Parliament would have effectively been tied 23 to 23, so once Bob Such became ill and stepped away then Geoff Brock, I think had no choice but to side with Labor.
The Liberals were reduced to 21 seats in May 2014 when Martin Hamilton-Smith became an independent and entered cabinet with Brock. Both Hamilton-Smith and Brock agreed to support the government on confidence and supply while retaining the right to otherwise vote on conscience. It is Labor's longest-serving South Australian government and the second longest-serving South Australian government behind the Playmander-assisted Thomas Playford IV. Aside from Playford, it is the second time that any party has won four consecutive state elections in South Australia, the first occurred when Don Dunstan led Labor to four consecutive victories between 1970 and 1977. Recent hung parliaments occurred when Labor came to government at the 2002 election and prior to that at the 1997 election which saw the South Australian Division of the Liberal Party of Australia, created in 1974, win re-election for the first time. Following the 2014 election, Labor went from minority to majority government when Nat Cook won the 2014 Fisher by-election by five votes from a 7.3 percent two-party swing which was triggered by the death of Such. Despite this, the Jay Weatherill Labor government kept Brock and Hamilton-Smith in cabinet, giving the government a 26 to 21 parliamentary majority.[2]
Redistributions and the two-party vote
To produce "fair" electoral boundaries, the Electoral Commission of South Australia (ECSA) has been required since the 1989 election to redraw boundaries after each election through a "fairness clause" in the state constitution, with the objective that the party which receives over 50 percent of the statewide two-party vote at the forthcoming election should win the two-party vote in a majority of seats in terms of "traditional" two-party matchups (Labor vs. Liberal).[3]
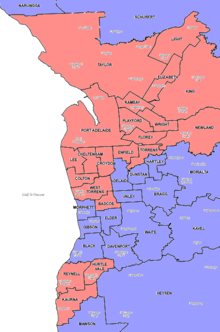
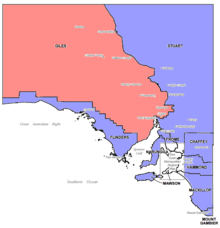
Labor has been in government for all but 12 years since the abolition of the Playmander in 1970 due primarily to its success in Adelaide. South Australia is the most centralised state in Australia. While the state has 1.7 million people, Adelaide's population is 1.3 million, over 75 percent of the state population. Due in part to a lack of comparatively-sized regional population centres, Adelaide is split between 34 of the 47 seats in the House of Assembly--almost three-fourths of the legislature. Therefore, to a far greater extent than other states, the metropolitan area tends to decide election outcomes. Elections since 1970 have been characterised by an extreme urban-rural split. Under normal conditions, Labor wins the most seats in Adelaide, while most Liberal support is packed into comfortably safe rural seats.
At the 2014 election for example, the state-wide two-party vote (2PP) was 47.0% Labor v 53.0% Liberal. However, much of the Liberal majority was wasted on landslides in its rural heartland. The metropolitan area recorded a 2PP of 51.5% Labor v 48.5% Liberal.[4]
The Liberals only won 12 of the 34 metropolitan seats; while only 4 of their 14 safe two-party seats (more than 10 percent 2PP) were urban, all of their "fairly safe" seats (7-10 percent 2PP) and marginal (less than seven percent 2PP) were in Adelaide. The two crossbenchers' seats, Such's seat of Fisher and Brock's seat of Frome, would have returned clear Liberal majorities in traditional two-party matchups. Since 24 seats would have returned Liberal majorities in traditional two-party matchups, the fairness clause was met.
One element of the Playmander remains to this day − the House of Assembly is still elected using single-member seats. Prior to the Playmander, the House of Assembly had always been elected using multi-member seats since the inaugural 1857 election.
Each Labor period of government since the end of the Playmander had at least one comprehensive win, allowing often-Liberal seats to be won by Labor candidates who then built up incumbency and personal popularity. Examples in 2014 were Mawson, Newland and Light, and additionally in 2010, Bright and Hartley – all gained at the 2006 election landslide. Mawson in fact swung toward Labor in 2010 and 2014 despite the statewide trend. The bellwether seat of Colton was retained by Labor. Furthermore, all but two of the nine Liberal-held metropolitan seats saw swings against the Liberals.
In contrast, the Liberals have had only one comprehensive victory in terms of both two-party vote and seat count--in 1993, when they won a record 61 percent of the two-party vote and all but nine seats in Adelaide. Their second-biggest two-party vote of this period, in 1979, saw them win 55 percent of the two-party vote, which is normally enough for a decisive majority in the rest of Australia. However, they only won a bare two-seat majority due to winning only 13 seats in Adelaide
In 2014, referring to the 1989 fairness legislation, Premier Jay Weatherill said, "Complaining about the rules when you designed the rules I think sits ill on the mouth of the Liberal Party." Electoral Commissioner Kay Mousley said it was an "impossible" task for the Boundaries Commission to achieve the legislated requirement, stating "It is a constitutional requirement, and until the constitution gets changed, I must say I find it a very inexact science".[5] Additionally, she had previously stated in 2010 "Had the Liberal Party achieved a uniform swing it would have formed Government. The Commission has no control over, and can accept no responsibility for, the quality of the candidates, policies and campaigns."[6] University of Adelaide Professor of Politics Clem Macintyre stated after the 2014 election that fair electoral boundaries are an "impossible challenge".[7]
2016 draft redistribution
The Electoral Districts Boundaries Commission on behalf of the ECSA on 15 August 2016 released the draft redistribution report and proposed electorate maps as calculated from the 24 Liberal−23 Labor seat result by two-party vote at the 2014 state election (2014 Fisher by-election not counted). The net change proposed would see a 25 Liberal−22 Labor seat count. Anyone who wished to lodge a final submission regarding the draft redistribution had one month to do so.[8]
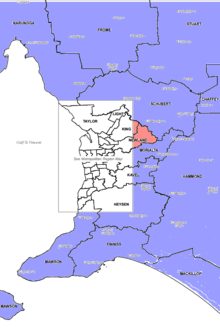
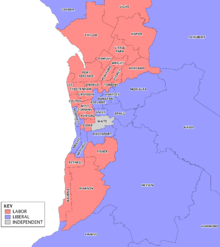
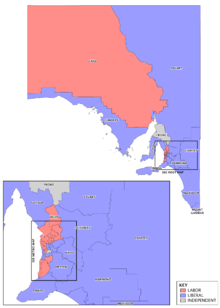
The proposed changes in the draft redistribution contain significant boundary redrawing with hundreds of thousands of voters affected. Seven seats would be renamed − Ashford would become Badcoe, Mitchell would become Black, Bright would become Gibson, Fisher would become Hurtle Vale, Napier would become King, Goyder would become Narungga, while Little Para would once again become Elizabeth. In two-party terms since the previous election, the seats of Mawson and Elder would become notionally Liberal-held seats, while Hurtle Vale would become a notionally Labor-held seat. Mawson in the outer southern suburbs would change the most, stretching along the coast right through to as far as Kangaroo Island. Hurtle Vale's margin change of 9 percent would be the largest in the state, with Mawson to change 8.3 percent and King to change 8 percent. Even with the history of the Playmander, it is also proposed that rural seats contain slightly less voters than metropolitan seats.[8][9][10][11]
Upon the release of the 2016 draft electoral redistribution, Liberal MP Rachel Sanderson organised the mass distribution of a pro forma document in the two inner metropolitan suburbs of Walkerville and Gilberton, aiming for residents to use the pro forma document to submit their objection to the commission in support of Sanderson's campaign to keep the two suburbs in her seat of Adelaide, which in the draft would be transferred to neighbouring Torrens. Sanderson's position however is at odds with her own party's submission which in fact agreed with the commission that Walkerville should be transferred to Torrens. Under the commission's draft proposal, the Liberal margin in Adelaide would be reduced from 2.4 percent to 0.6 percent, but would result in the Labor margin in Torrens reduced from 3.5 percent to 1.1 percent. Of 130 total submissions received in response to the draft redistribution, about 100 (over three quarters of all submissions) were from Walkerville and Gilberton.[12][13][14][15][16][17]
Pre-redistribution pendulum
The following Mackerras Pendulum works by lining up all of the seats according to the percentage point margin on a two candidate preferred basis based on the 2014 results and changes since.[18][19] "Safe" seats require a swing of over 10 per cent to change, "fairly safe" seats require a swing of between 6 and 10 per cent, while "marginal" seats require a swing of less than 6 per cent.[20]
The Liberals were reduced to 21 seats in May 2014 when Martin Hamilton-Smith became an independent and entered cabinet with Geoff Brock. Both Hamilton-Smith and Brock agreed to support the Labor government on confidence and supply while retaining the right to otherwise vote on conscience.[21][22] Labor achieved majority government when Nat Cook won the 2014 Fisher by-election which was triggered by the death of Bob Such by five votes from a 7.3 percent two-party swing. On a 0.02 percent margin it is the most marginal seat in parliament. Despite this, the Jay Weatherill Labor government kept Brock and Hamilton-Smith in cabinet, giving the government a 26 to 21 parliamentary majority.[2]
|
| ||||||||||||||||||||||||||||||||||||||||||||||||||||||||||||||||||||||||||||||||||||||||||||||||||||||||||||||||||||||||||||||||||||||||||||||||||||||||||||||||||||||||||||||||||||||||||||||||||||||||||||||||||||||||||||||||
| Current (2014–18) members of the South Australian Legislative Council | |||||
|---|---|---|---|---|---|
| Labor (8) | Liberal (8) | Green (2) | Family First (2) | No Pokies (1) | Dignity for Disability (1) |
|
elected 2014: |
elected 2014: |
elected 2014: |
elected 2014: |
elected 2014: | |
|
elected 2010: |
elected 2010: |
elected 2010: |
elected 2010: |
elected 2010: | |
By-elections
Independent Bob Such in Fisher died from a brain tumour on 11 October 2014 which triggered a 2014 Fisher by-election for 6 December.[23] Labor's Nat Cook won the by-election by five votes with a 7.3 percent two-party swing against the Liberals, resulting in a change from minority to majority government. On a 0.02 percent margin it is the most marginal seat in parliament.[2] Despite this, the Jay Weatherill Labor government kept crossbench MPs Geoff Brock and Martin Hamilton-Smith in cabinet, giving the government a 26 to 21 parliamentary majority.[2] ABC psephologist Antony Green described the by-election as a "very bad result for the Liberal Party in South Australia" both state and federally, and that a fourth term government gaining a seat at a by-election is unprecedented in Australian history.[24]
Liberal Iain Evans in Davenport resigned from parliament on 30 October 2014 which triggered a 2015 Davenport by-election for 31 January.[25][26][27][28] Liberal Sam Duluk won the seat despite a five percent two-party swing, turning the historically safe seat of Davenport in to a two-party marginal seat for the first time.[29] ABC psephologist Antony Green described it as "another poor result for the South Australian Liberal Party",[30] following the 2014 Fisher by-election which saw Labor go from minority to majority government.[2]
Upper house casual vacancy
Following the parliamentary resignation of Bernard Finnigan on 12 November 2015, Peter Malinauskas filled the Legislative Council casual vacancy in a joint sitting of the Parliament of South Australia on 1 December.[31]
Date
The last state election was held on 15 March 2014 to elect members for the House of Assembly and half of the members in the Legislative Council. In South Australia, section 28 of the Constitution Act 1934, as amended in 2001, directs that parliaments have fixed four-year terms, and elections must be held on the third Saturday in March every four years unless this date falls the day after Good Friday, occurs within the same month as a Commonwealth election, or the conduct of the election could be adversely affected by a state disaster. Section 28 also states that the Governor may also dissolve the Assembly and call an election for an earlier date if the Government has lost the confidence of the Assembly or a bill of special importance has been rejected by the Legislative Council. Section 41 states that both the Council and the Assembly may also be dissolved simultaneously if a deadlock occurs between them.[32]
The Electoral (Miscellaneous) Amendment Act 2013 introduced set dates for writs for general elections in South Australia. The writ sets the dates for the close of the electoral roll and the close of nominations for an election. The Electoral Act 1985 requires that, for a general election, the writ be issued 28 days before the date fixed for polling (S47(2a)) and the electoral roll be closed at 12 noon, 6 days after the issue of the writ (S48(3(a)(i). The close of nominations will be at 12 noon 3 days after the close of rolls (Electoral Act 1985 S48(4)(a) and S4(1)).
Since the previous election, one new party has registered: Danig Party of Australia. Two are no longer registered: Fishing and Lifestyle Party and Multicultural Progress Party.[33]
Polling
Polling conducted by Newspoll and published in The Australian is conducted via random telephone number selection in city and country areas. Sampling sizes usually consists of over 800 electors, while the 10–13 March 2014 poll consisted of 1602 electors. The declared margin of errors at these sample sizes is ±3.5 percent and ±2.5 percent respectively.
The July to September 2014 Newspoll saw Labor leading the Liberals on the two-party-preferred vote for the first time since 2009.[34][35] The October to December 2015 Newspoll saw Marshall's leadership approval rating plummet 11 points to 30 percent, the equal lowest Newspoll approval rating in history for a South Australian Opposition Leader since Dale Baker in 1990.[36][37][35]
| Primary vote | TPP vote | |||||||||
|---|---|---|---|---|---|---|---|---|---|---|
| ALP | Lib | Grn | Oth | ALP | Lib | |||||
| Oct–Dec 2015[38] | 36% | 38% | 9% | 17% | 51% | 49% | ||||
| Apr–Jun 2015 | 36% | 33% | 10% | 21% | 54% | 46% | ||||
| Jan–Mar 2015 | 36% | 33% | 10% | 21% | 54% | 46% | ||||
| Oct–Dec 2014 | 35% | 33% | 10% | 22% | 53% | 47% | ||||
| Jul–Sep 2014 | 34% | 36% | 9% | 21% | 51% | 49% | ||||
| 15 Mar 2014 election | 35.8% | 44.8% | 8.7% | 10.7% | 47.0% | 53.0% | ||||
| 10–13 Mar 2014 | 34% | 41% | 9% | 16% | 47.7% | 52.3% | ||||
| 21–27 Feb 2014 | 34% | 44% | 7% | 15% | 46% | 54% | ||||
| Polling conducted by Newspoll and published in The Australian. | ||||||||||
| Better Premier | Weatherill | Marshall | ||||||
|---|---|---|---|---|---|---|---|---|
| Weatherill | Marshall | Satisfied | Dissatisfied | Satisfied | Dissatisfied | |||
| Oct–Dec 2015[38] | 42% | 27% | 37% | 46% | 30% | 44% | ||
| Apr–Jun 2015 | 48% | 29% | 45% | 43% | 41% | 39% | ||
| Jan–Mar 2015 | 47% | 31% | 43% | 41% | 41% | 37% | ||
| Oct–Dec 2014 | 47% | 29% | 46% | 42% | 35% | 42% | ||
| Jul–Sep 2014 | 45% | 30% | 45% | 37% | 40% | 34% | ||
| 15 Mar 2014 election | – | – | – | – | – | – | ||
| 10–13 Mar 2014 | 43% | 37% | 42% | 42% | 42% | 35% | ||
| 21–27 Feb 2014 | 40% | 39% | 43% | 44% | 45% | 29% | ||
| Polling conducted by Newspoll and published in The Australian. ^ Remainder were "uncommitted" to either leader. | ||||||||
See also
- South Australian state election, 2014
- Candidates of the South Australian state election, 2014
- Members of the South Australian House of Assembly, 2014–2018
- Members of the South Australian Legislative Council, 2014–2018
References
- ↑ By-election for Bob Such's seat of Fisher expected to put pressure on Weatherill Government: ABC 13 October 2014
- 1 2 3 4 5 Fisher by-election win for Labor gives Weatherill Government majority in SA: ABC 13 December 2014
- ↑ The 1989 South Australian election, Australian Journal of Political Science, Dean Jaensch
- ↑ Metropolitan 2PP correctly calculated by adding raw metro 2PP vote numbers from the 34 metro seats, both Labor and Liberal, then dividing Labor's raw metro 2PP vote from the total, which revealed a Labor metropolitan 2PP of 51.54%. Obtained raw metro 2PP vote numbers from ECSA 2014 election statistics, ECSA 2014 Heysen election and ABC 2014 Fisher by-election.
- ↑ Liberals blocked by unfair boundaries, says Downer: The Australian 17 March 2014
- ↑ "Draft Redistribution Report". Electoral Commission of South Australia. 12 August 2011. Retrieved 9 June 2012.
- ↑ Fair electoral boundaries an "impossible challenge": University of Adelaide, 21 March 2014
- 1 2 Draft Report (PDF): Electoral Districts Boundaries Commission 15 August 2016
- ↑ Electoral boundary reform in South Australia does not go far enough, Opposition says: ABC 15 August 2016
- ↑ Libs seething after another boundaries blow: InDaily 15 August 2016
- ↑ South Australian electoral boundaries redraw: The reaction: The Advertiser 16 August 2016
- ↑ Adelaide residents compared to 'Hyacinth Bucket' for lashing out at proposed electoral shift - ABC 22 September 2016
- ↑ Patrician burghers of Adelaide lament: 'Won't someone think of the rotary clubs?' - InDaily 22 September 2016
- ↑ Libs' last-ditch bid for "electoral fairness" - InDaily 28 September 2016
- ↑ MPs make submissions into South Australian boundary changes - The Advertiser 22 September 2016
- ↑ Draft Report (PDF): Electoral Districts Boundaries Commission 15 August 2016
- ↑ Detail and download of all 130 submissions submitted: Electoral Districts Boundaries Commission
- ↑ "2014 SA pendulum". 2014 South Australian Election. ABC.net.au.
- ↑ 2014 SA election House of Assembly final results: ECSA
- ↑ Political party name abbreviations & codes, demographic ratings and seat status: AEC
- ↑ "Martin Hamilton-Smith quits Liberals to back South Australian Labor Government". ABC News. 2014-05-28. Retrieved 2014-05-28.
- ↑ Former Liberal leader Martin Hamilton-Smith attends first Labor Cabinet meeting in SA: ABC 2 June 2014
- ↑ South Australian MP Bob Such dies in hospital after suffering a brain tumour: ABC 11 October 2014
- ↑ Likely Shock Labor By-Election Win in SA: The Conversation 4 December 2014
- ↑ Iain Evans to quit, Senior Liberal will retire from SA politics and force by-election: ABC 6 June 2014
- ↑ Speaker Michael Atkinson defends decision to separate two SA by-elections: ABC 21 October 2014
- ↑ Departing SA Liberal Iain Evans takes final swipe at parliamentary colleagues: ABC 30 October 2014
- ↑ Davenport by-election date in South Australia set for January 31: ABC 13 November 2014
- ↑ Liberals withstand swing to win by-election in South Australian seat of Davenport: ABC 31 January 2015
- ↑ 2015 Davenport by-election commentary: Antony Green ABC
- ↑ Peter Malinauskas formally fills Legislative Council vacancy in South Australian Parliament: ABC 1 December 2015
- ↑ "Australian elections timetable". Australian Parliamentary Library. Retrieved 5 February 2013.
- ↑ "Registered Political Parties". ECSA.sa.gov.au.
- ↑ Newspoll: 51–49 to Labor in South Australia – Crikey 29 September 2014
- 1 2 South Australian Newspoll archive
- ↑ SA electors searching for proof of Liberal life: InDaily 15 January 2016
- ↑ Mr Unpopularity's poll dip laid bare: InDaily 14 January 2016
- 1 2 Oct–Dec 2015 Newspoll (PDF)
| General elections | |
|---|---|
| Referendums | |
| Commonwealth |  | |
|---|---|---|
| Federal elections | ||
| State/Territory governments | ||
| State/Territory elections | ||
| Local government | ||
| Political parties | ||