St Albans City and District Council election, 2000
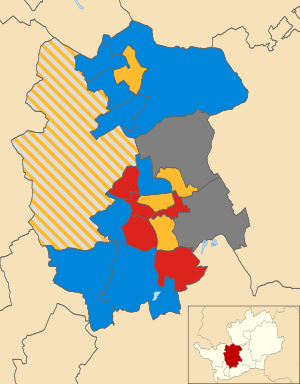
Map of the results of the 2000 St Albans City and District Council election. Conservatives in blue, Liberal Democrats in yellow, Labour in red and independent in light grey. Wards in dark grey were not contested in 2000.
The 2000 St Albans City and District Council election took place on 4 May 2000 to elect members of St Albans District Council in Hertfordshire, England. One third of the council was up for election and the council stayed under no overall control.[1]
After the election, the composition of the council was
- Liberal Democrats 23
- Conservative 19
- Labour 15
- Independent 1[2]
Election result
Overall turnout at the election was 33.56%,[3] down from 37.1% at the 1999 election.[4]
| St Albans local election result 2000[3][5] | ||||||||||
|---|---|---|---|---|---|---|---|---|---|---|
| Party | Seats | Gains | Losses | Net gain/loss | Seats % | Votes % | Votes | +/− | ||
| Conservative | 8 | 1 | 3 | -2 | 42.1 | 40.2 | 13,205 | +5.7% | ||
| Liberal Democrat | 5 | 3 | 1 | +2 | 26.3 | 32.7 | 10,715 | -2.1% | ||
| Labour | 5 | 0 | 1 | -1 | 26.3 | 23.9 | 7,838 | -6.6% | ||
| Independent | 1 | 1 | 0 | +1 | 5.3 | 3.1 | 1,013 | +2.9% | ||
| Natural Law | 0 | 0 | 0 | 0 | 0 | 0.1 | 37 | +0.1% | ||
Ward results
| Party | Candidate | Votes | % | ± | |
|---|---|---|---|---|---|
| Labour | Edward Hill | 714 | 48.3 | ||
| Liberal Democrat | Moira Seton | 400 | 27.1 | ||
| Conservative | Peter White | 363 | 24.6 | ||
| Majority | 314 | 21.3 | |||
| Turnout | 1,477 | 28.2 | -16.5 | ||
| Labour hold | Swing | ||||
| Party | Candidate | Votes | % | ± | |
|---|---|---|---|---|---|
| Labour | Andrew Rose | 834 | 60.5 | ||
| Conservative | Margaret Brownlie | 368 | 26.7 | ||
| Liberal Democrat | Carol Prowse | 176 | 12.8 | ||
| Majority | 466 | 33.8 | |||
| Turnout | 1,378 | 27.7 | -5.1 | ||
| Labour hold | Swing | ||||
| Party | Candidate | Votes | % | ± | |
|---|---|---|---|---|---|
| Liberal Democrat | John Wright | 790 | 47.3 | ||
| Labour | Dawn Pratley | 478 | 28.6 | ||
| Conservative | James Vessey | 403 | 24.1 | ||
| Majority | 312 | 18.7 | |||
| Turnout | 1,671 | 35.3 | |||
| Liberal Democrat hold | Swing | ||||
| Party | Candidate | Votes | % | ± | |
|---|---|---|---|---|---|
| Liberal Democrat | Geoffrey Harrison | 813 | 43.0 | ||
| Labour | Andrew Gilson | 693 | 36.7 | ||
| Conservative | Diana Hall | 383 | 20.3 | ||
| Majority | 120 | 6.4 | |||
| Turnout | 1,889 | 39.4 | -5.6 | ||
| Liberal Democrat gain from Labour | Swing | ||||
| Party | Candidate | Votes | % | ± | |
|---|---|---|---|---|---|
| Liberal Democrat | Brian Peyton | 974 | 45.6 | ||
| Conservative | Michael Clark | 847 | 39.7 | ||
| Labour | David Crew | 277 | 13.0 | ||
| Natural Law | Patricia Saunders | 37 | 1.7 | ||
| Majority | 127 | 5.9 | |||
| Turnout | 2,135 | 40.1 | +2.0 | ||
| Liberal Democrat gain from Conservative | Swing | ||||
| Party | Candidate | Votes | % | ± | |
|---|---|---|---|---|---|
| Conservative | John Chambers | 901 | 55.3 | ||
| Liberal Democrat | Valerie Goodyear | 565 | 34.7 | ||
| Labour | Richard Botterill | 164 | 10.1 | ||
| Majority | 336 | 20.6 | |||
| Turnout | 1,630 | 31.0 | -3.9 | ||
| Conservative hold | Swing | ||||
| Party | Candidate | Votes | % | ± | |
|---|---|---|---|---|---|
| Conservative | Martin Treasure | 1,092 | 65.9 | ||
| Liberal Democrat | Christopher Canfield | 325 | 19.6 | ||
| Labour | Linda Spiri | 239 | 14.4 | ||
| Majority | 767 | 46.3 | |||
| Turnout | 1,656 | 31.4 | -4.8 | ||
| Conservative hold | Swing | ||||
| Party | Candidate | Votes | % | ± | |
|---|---|---|---|---|---|
| Conservative | John Newman | 1,155 | 67.1 | ||
| Liberal Democrat | Paul Spinks | 323 | 18.8 | ||
| Labour | Richard Ough | 244 | 14.2 | ||
| Majority | 832 | 48.3 | |||
| Turnout | 1,722 | 30.3 | -3.7 | ||
| Conservative hold | Swing | ||||
| Party | Candidate | Votes | % | ± | |
|---|---|---|---|---|---|
| Labour | Sean Flynn | 816 | 59.0 | ||
| Conservative | Derek Caroline | 358 | 25.9 | ||
| Liberal Democrat | Robert Prowse | 208 | 15.1 | ||
| Majority | 458 | 33.1 | |||
| Turnout | 1,382 | 23.6 | -2.8 | ||
| Labour hold | Swing | ||||
| Party | Candidate | Votes | % | ± | |
|---|---|---|---|---|---|
| Liberal Democrat | Jennifer Stroud | 878 | 47.1 | ||
| Conservative | John Foster | 706 | 37.9 | ||
| Labour | John Baughan | 281 | 15.1 | ||
| Majority | 172 | 9.2 | |||
| Turnout | 1,865 | 37.1 | -2.7 | ||
| Liberal Democrat hold | Swing | ||||
| Party | Candidate | Votes | % | ± | |
|---|---|---|---|---|---|
| Conservative | Michael Bretherton | 880 | 42.3 | ||
| Liberal Democrat | Joy Winder | 858 | 41.3 | ||
| Labour | Janet Smith | 341 | 16.4 | ||
| Majority | 22 | 1.1 | |||
| Turnout | 2,079 | 40.4 | -1.8 | ||
| Conservative gain from Liberal Democrat | Swing | ||||
| Party | Candidate | Votes | % | ± | |
|---|---|---|---|---|---|
| Conservative | Michael Jameson | 749 | 43.5 | ||
| Liberal Democrat | James Finley | 651 | 37.8 | ||
| Labour | Donald Williamson | 323 | 18.7 | ||
| Majority | 98 | 5.7 | |||
| Turnout | 1,723 | 32.1 | -0.6 | ||
| Conservative hold | Swing | ||||
| Party | Candidate | Votes | % | ± | |
|---|---|---|---|---|---|
| Independent | Anthony Swendell | 1,013 | |||
| Liberal Democrat | Christopher O'Donovan | 824 | |||
| Conservative | Brian Chapman | 796 | |||
| Conservative | Paul Finigan | 576 | |||
| Labour | Vivienne Windle | 201 | |||
| Labour | John Paton | 141 | |||
| Turnout | 3,551 | 41.4 | +0.0 | ||
| Independent gain from Conservative | Swing | ||||
| Liberal Democrat gain from Conservative | Swing | ||||
| Party | Candidate | Votes | % | ± | |
|---|---|---|---|---|---|
| Labour | Sinead Coyle | 763 | 60.4 | ||
| Conservative | Geoffrey Brown | 339 | 26.8 | ||
| Liberal Democrat | Peter Harris | 162 | 12.8 | ||
| Majority | 424 | 33.5 | |||
| Turnout | 1,264 | 24.1 | -4.8 | ||
| Labour hold | Swing | ||||
| Party | Candidate | Votes | % | ± | |
|---|---|---|---|---|---|
| Labour | Helen Ives-Rose | 673 | 43.4 | ||
| Liberal Democrat | Ilyas Khan | 578 | 37.3 | ||
| Conservative | Sheila Sanders | 299 | 19.3 | ||
| Majority | 95 | 6.1 | |||
| Turnout | 1,550 | 29.8 | -4.6 | ||
| Labour hold | Swing | ||||
| Party | Candidate | Votes | % | ± | |
|---|---|---|---|---|---|
| Conservative | Hazel Ward | 1,009 | 56.2 | ||
| Liberal Democrat | Khalil Moghul | 530 | 29.5 | ||
| Labour | Patricia Allen | 255 | 14.2 | ||
| Majority | 479 | 26.7 | |||
| Turnout | 1,794 | 35.1 | -3.1 | ||
| Conservative hold | Swing | ||||
| Party | Candidate | Votes | % | ± | |
|---|---|---|---|---|---|
| Conservative | Clare Ellis | 1,034 | 47.2 | ||
| Liberal Democrat | Kathleen Morris | 924 | 42.2 | ||
| Labour | Jillian Butchart | 231 | 10.6 | ||
| Majority | 110 | 5.0 | |||
| Turnout | 2,189 | 41.9 | -3.9 | ||
| Conservative hold | Swing | ||||
| Party | Candidate | Votes | % | ± | |
|---|---|---|---|---|---|
| Conservative | Gillian Clark | 947 | 51.1 | ||
| Liberal Democrat | Paul Edelston | 736 | 39.7 | ||
| Labour | Michael Fletcher | 170 | 9.2 | ||
| Majority | 211 | 11.4 | |||
| Turnout | 1,853 | 38.9 | -5.6 | ||
| Conservative hold | Swing | ||||
By-elections between 2000 and 2002
Park Street
A by-election was held in Park Street ward on 12 October 2000 after the resignation of Liberal Democrat councillor Barry Blackwall.[6][7]
| Party | Candidate | Votes | % | ± | |
|---|---|---|---|---|---|
| Liberal Democrat | 1,039 | 57.3 | +19.5 | ||
| Conservative | 612 | 33.8 | -9.7 | ||
| Labour | 161 | 8.9 | -9.8 | ||
| Majority | 427 | 23.6 | |||
| Turnout | 1,812 | 33.0 | +0.9 | ||
| Liberal Democrat hold | Swing | ||||
Sopwell
| Party | Candidate | Votes | % | ± | |
|---|---|---|---|---|---|
| Labour | 1,695 | 55.6 | -4.8 | ||
| Conservative | 708 | 23.2 | -3.6 | ||
| Liberal Democrat | 544 | 17.9 | +5.1 | ||
| Other | 99 | 3.3 | +3.3 | ||
| Majority | 987 | 32.4 | -1.1 | ||
| Turnout | 3,046 | ||||
| Labour hold | Swing | ||||
References
- ↑ "St Albans". BBC News Online. Retrieved 2009-11-09.
- ↑ "Local council results". Financial Times. 2000-05-06. p. 6.
- 1 2 3 4 5 6 7 8 9 10 11 12 13 14 15 16 17 18 19 20 "District Council Election Results - 4 May 2000". St Albans City and District Council. Archived from the original on 1 October 2002. Retrieved 9 January 2015.
- ↑ "Only a quarter of the electorate turned out to vote in one ward as the first all-out council election for 25 years failed to capture the public's imagination.". Hertfordshire County Publications. NewsBank. 29 May 1999.
- ↑ "Election results: local councils". The Times. 2000-05-06. p. 10.
- ↑ "Councillor behind CPZ steps down". Hertfordshire County Publications. NewsBank. 25 August 2000.
- 1 2 "Local Authority Byelection Results October 2000". Local Authority Byelection Results. Retrieved 9 January 2015.
- ↑ "Local Authority Byelection Results - June 2001". Local Authority Byelection Results. Retrieved 9 January 2015.
This article is issued from Wikipedia - version of the 4/21/2016. The text is available under the Creative Commons Attribution/Share Alike but additional terms may apply for the media files.