Brent London Borough Council election, 2006
The 2006 Brent London Borough Council election took place on 4 May 2006 to elect members of Brent London Borough Council in London, England. The whole council was up for election and the Labour party lost overall control of the council to no overall control.[1]
Background
Since the last election in 2002 a Conservative councillor, Carol Shaw of Brondesbury Park ward, had defected to the Liberal Democrats,[2] while in April 2006 Labour councillor, Jonathan Davies of Queen's Park ward, also joined the Liberal Democrats.[3] In the Brent area the Liberal Democrats had also gained the parliamentary seat of Brent East from Labour at a 2003 by-election and held the seat at the 2005 general election.[4][5] The defections meant that before the election Labour had 34 seats on the council, compared to 18 for the Conservatives and 11 for the Liberal Democrats.[1]
Election result
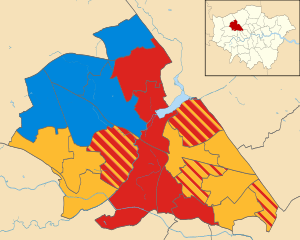
The Liberal Democrats gained 16 seats to leave no party with a majority on the council, but the Liberal Democrats became the largest party with 27 councillors.[6][7] The Liberal Democrat gains were mainly at the expense of Labour,[6] who suffered a net loss of 13 seats.[8]
Following the election a coalition between the Liberal Democrats and Conservatives took control of the council, with Liberal Democrat Paul Lorber becoming the leader of the council and Conservative Bob Blackman deputy leader.[9]
| Brent local election result 2006[10][11] | ||||||||||
|---|---|---|---|---|---|---|---|---|---|---|
| Party | Seats | Gains | Losses | Net gain/loss | Seats % | Votes % | Votes | +/− | ||
| Liberal Democrat | 27 | 16 | 0 | +16 | 42.9 | 29.4 | 56,129 | +12.1% | ||
| Labour | 21 | 2 | 15 | -13 | 33.3 | 35.4 | 67,574 | -8.8% | ||
| Conservative | 15 | 3 | 6 | -3 | 23.8 | 30.3 | 57,848 | -4.6% | ||
| Green | 0 | 0 | 0 | 0 | 0 | 4.3 | 8,120 | +1.8% | ||
| Independent | 0 | 0 | 0 | 0 | 0 | 0.3 | 534 | -0.2% | ||
| Respect | 0 | 0 | 0 | 0 | 0 | 0.2 | 463 | +0.2% | ||
Ward results
| Party | Candidate | Votes | % | ± | |
|---|---|---|---|---|---|
| Liberal Democrat | Daniel Brown | 1,624 | |||
| Liberal Democrat | Chunilal Chavda | 1,560 | |||
| Liberal Democrat | James Allie | 1,481 | |||
| Labour | Benjamin Ogunro | 1,061 | |||
| Labour | Leon Turini | 1,033 | |||
| Conservative | Jaydutt Desai | 790 | |||
| Conservative | Ramnik Parmar | 699 | |||
| Conservative | Shailesh Shukla | 645 | |||
| Green | Ali Jazerli | 151 | |||
| Turnout | 9,044 | 41 | +4 | ||
| Liberal Democrat hold | Swing | ||||
| Liberal Democrat hold | Swing | ||||
| Liberal Democrat hold | Swing | ||||
| Party | Candidate | Votes | % | ± | |
|---|---|---|---|---|---|
| Conservative | James O'Sullivan | 1,622 | |||
| Conservative | Suresh Kansagra | 1,460 | |||
| Conservative | Irwin Colle | 1,435 | |||
| Labour | Judith Beckham | 1,012 | |||
| Labour | Shafique Choudhary | 872 | |||
| Labour | Peter Coghill | 851 | |||
| Liberal Democrat | Shashi Makhija | 386 | |||
| Liberal Democrat | Simon Marcos | 386 | |||
| Liberal Democrat | Brenda Shuttleworth | 377 | |||
| Green | Aatif Nawaz | 374 | |||
| Turnout | 8,775 | 33 | +0 | ||
| Conservative hold | Swing | ||||
| Conservative hold | Swing | ||||
| Conservative hold | Swing | ||||
| Party | Candidate | Votes | % | ± | |
|---|---|---|---|---|---|
| Liberal Democrat | Carol Shaw | 1,554 | |||
| Liberal Democrat | Mark Cummins | 1,249 | |||
| Liberal Democrat | Rob Pagnamenta | 1,075 | |||
| Conservative | William Duffin | 710 | |||
| Conservative | Joan Padro | 663 | |||
| Conservative | John Warren | 647 | |||
| Labour | Steven Mitchell | 517 | |||
| Labour | Robert Dignan | 494 | |||
| Green | Simon Collins | 460 | |||
| Labour | John Iloba | 445 | |||
| Independent | Maurice Morris | 197 | |||
| Independent | Michael Fedonos | 194 | |||
| Turnout | 8,205 | 40 | +11 | ||
| Liberal Democrat hold | Swing | ||||
| Liberal Democrat gain from Conservative | Swing | ||||
| Liberal Democrat gain from Conservative | Swing | ||||
| Party | Candidate | Votes | % | ± | |
|---|---|---|---|---|---|
| Labour | Lena Ahmed | 1,177 | |||
| Liberal Democrat | Alec Castle | 1,079 | |||
| Labour | Ralph Fox | 1,052 | |||
| Liberal Democrat | Richard Sisson | 1,042 | |||
| Liberal Democrat | Haththimuni De Silva | 1,021 | |||
| Labour | Abdul Sattar-Butt | 1,007 | |||
| Conservative | Manubhai Makwana | 727 | |||
| Conservative | Annesley Abercorn | 720 | |||
| Conservative | Brian Cattell | 693 | |||
| Green | Rosie Leventon | 187 | |||
| Turnout | 8,705 | 39 | +9 | ||
| Labour hold | Swing | ||||
| Liberal Democrat gain from Labour | Swing | ||||
| Labour hold | Swing | ||||
| Party | Candidate | Votes | % | ± | |
|---|---|---|---|---|---|
| Liberal Democrat | David Clues | 1,460 | |||
| Liberal Democrat | Pawan Gupta | 1,277 | |||
| Liberal Democrat | Chunilal Hirani | 1,195 | |||
| Labour | Mohammad Choudry | 1,163 | |||
| Labour | Patricia Harrison | 1,099 | |||
| Labour | Michael Lyon | 1,017 | |||
| Conservative | Mohammed Alghoul | 579 | |||
| Conservative | Jason McKee | 551 | |||
| Conservative | Manal Elfeitury | 527 | |||
| Green | Clare Homer | 381 | |||
| Turnout | 9,249 | 38 | +10 | ||
| Liberal Democrat gain from Labour | Swing | ||||
| Liberal Democrat gain from Labour | Swing | ||||
| Liberal Democrat gain from Labour | Swing | ||||
| Party | Candidate | Votes | % | ± | |
|---|---|---|---|---|---|
| Labour | George Crane | 1,605 | |||
| Labour | James Moher | 1,589 | |||
| Labour | Ruth Moher | 1,533 | |||
| Conservative | Jane McClay | 1,320 | |||
| Conservative | Christie Fernandes | 1,265 | |||
| Conservative | Sean Fear | 1,233 | |||
| Liberal Democrat | Sakina Akhter | 459 | |||
| Liberal Democrat | Rita Lyons | 415 | |||
| Liberal Democrat | Henry Wright | 369 | |||
| Green | Brian Orr | 240 | |||
| Turnout | 10,028 | 41 | +9 | ||
| Labour hold | Swing | ||||
| Labour hold | Swing | ||||
| Labour hold | Swing | ||||
| Party | Candidate | Votes | % | ± | |
|---|---|---|---|---|---|
| Labour | Lincoln Beswick | 1,410 | |||
| Labour | Janice Long | 1,270 | |||
| Labour | David Coughlin | 1,244 | |||
| Liberal Democrat | Christopher Anderson | 470 | |||
| Respect | Albert Harriott | 463 | |||
| Liberal Democrat | Leslie Lewis | 410 | |||
| Conservative | Natalie Colwill | 334 | |||
| Liberal Democrat | Andrew Scott | 326 | |||
| Green | Cecilia Litvinoff | 321 | |||
| Conservative | Sumitra Mistry | 271 | |||
| Conservative | Smart Owaka | 254 | |||
| Turnout | 6,773 | 27 | +5 | ||
| Labour hold | Swing | ||||
| Labour hold | Swing | ||||
| Labour hold | Swing | ||||
| Party | Candidate | Votes | % | ± | |
|---|---|---|---|---|---|
| Labour | Bertha Joseph | 1,331 | |||
| Labour | James Powney | 1,169 | |||
| Labour | Bobby Thomas | 1,108 | |||
| Liberal Democrat | Felicity Hunt | 671 | |||
| Liberal Democrat | Penelope Lowcock | 583 | |||
| Green | Michael Collins | 573 | |||
| Liberal Democrat | Carmel O'Dwyer | 555 | |||
| Green | Philip Dymond | 473 | |||
| Conservative | Valerie Jennings-Trott | 356 | |||
| Conservative | Rosaline Owaka | 326 | |||
| Conservative | Nagin Parmar | 298 | |||
| Turnout | 7,443 | 30 | +7 | ||
| Labour hold | Swing | ||||
| Labour hold | Swing | ||||
| Labour hold | Swing | ||||
| Party | Candidate | Votes | % | ± | |
|---|---|---|---|---|---|
| Conservative | Reg Colwill | 1,944 | |||
| Conservative | Uma Fernandes | 1,891 | |||
| Conservative | Arthur Steel | 1,828 | |||
| Labour | Robert Freedman | 1,043 | |||
| Labour | Mary Mears | 976 | |||
| Labour | Eugene Sedze | 779 | |||
| Liberal Democrat | Jagdish Patel | 526 | |||
| Liberal Democrat | Eileen Barker | 483 | |||
| Liberal Democrat | Deborah Sutherland | 369 | |||
| Green | Gareth Moors | 276 | |||
| Turnout | 10,115 | 40 | +5 | ||
| Conservative hold | Swing | ||||
| Conservative hold | Swing | ||||
| Conservative hold | Swing | ||||
| Party | Candidate | Votes | % | ± | |
|---|---|---|---|---|---|
| Liberal Democrat | Anthony Dunn | 1,440 | |||
| Labour | Mary Arnold | 1,369 | |||
| Liberal Democrat | Derek Jackson | 1,175 | |||
| Liberal Democrat | Hugh Lawson-Tancred | 1,156 | |||
| Labour | Noel Thompson | 976 | |||
| Green | John McCooke | 532 | |||
| Green | Peter Murry | 365 | |||
| Conservative | Charles Garner | 364 | |||
| Conservative | Cormach Moore | 303 | |||
| Conservative | Monica Roberts | 303 | |||
| Turnout | 7,983 | 31 | +10 | ||
| Liberal Democrat gain from Labour | Swing | ||||
| Labour hold | Swing | ||||
| Liberal Democrat gain from Labour | Swing | ||||
| Party | Candidate | Votes | % | ± | |
|---|---|---|---|---|---|
| Liberal Democrat | Hayley Matthews | 1,326 | |||
| Liberal Democrat | Chris Leaman | 1,277 | |||
| Liberal Democrat | Sami Hashmi | 1,016 | |||
| Labour | Ian Bellia | 1,008 | |||
| Conservative | Kahlid Dar | 966 | |||
| Labour | Rizwana Ali | 881 | |||
| Conservative | Jack Sayers | 861 | |||
| Conservative | Jennifer Brown | 754 | |||
| Labour | Mohammad Zakriya | 703 | |||
| Green | Daniel Scrimgeour | 530 | |||
| Turnout | 9,322 | 36 | +8 | ||
| Liberal Democrat gain from Labour | Swing | ||||
| Liberal Democrat gain from Labour | Swing | ||||
| Liberal Democrat gain from Conservative | Swing | ||||
| Party | Candidate | Votes | % | ± | |
|---|---|---|---|---|---|
| Conservative | Eddie Baker | 1,564 | |||
| Conservative | Harihar Patel | 1,451 | |||
| Conservative | John Detre | 1,410 | |||
| Labour | Lawrence Safir | 784 | |||
| Labour | Mustapha Ishola-Jimoh | 780 | |||
| Liberal Democrat | Toby Keynes | 682 | |||
| Liberal Democrat | Jeetender Dass | 629 | |||
| Green | Michael O'Brien | 267 | |||
| Turnout | 7,567 | 35 | +3 | ||
| Conservative hold | Swing | ||||
| Conservative hold | Swing | ||||
| Conservative hold | Swing | ||||
| Party | Candidate | Votes | % | ± | |
|---|---|---|---|---|---|
| Conservative | Bob Blackman | 2,010 | |||
| Conservative | Alan Mendoza | 1,852 | |||
| Conservative | Harshadbhai Patel | 1,830 | |||
| Labour | Mary Daly | 1,014 | |||
| Labour | Robina Zakriya | 880 | |||
| Labour | Karanodakasayi Dasa | 850 | |||
| Liberal Democrat | Jacqueline Bunce-Linsell | 439 | |||
| Liberal Democrat | Vivienne Williamson | 372 | |||
| Liberal Democrat | Jonathan Pincus | 357 | |||
| Green | Jonathan Liddell | 273 | |||
| Turnout | 9,877 | 37 | +3 | ||
| Conservative hold | Swing | ||||
| Conservative hold | Swing | ||||
| Conservative hold | Swing | ||||
| Party | Candidate | Votes | % | ± | |
|---|---|---|---|---|---|
| Liberal Democrat | Emily Tancred | 1,284 | |||
| Liberal Democrat | Jean Tullett | 1,184 | |||
| Liberal Democrat | Will Motley | 1,102 | |||
| Labour | Reginald Freeson | 1,055 | |||
| Labour | Helga Gladbaum | 1,010 | |||
| Green | Ropert Degas | 526 | |||
| Conservative | Gurmaj Dhillon | 494 | |||
| Conservative | William Wearmouth | 486 | |||
| Green | Shahrar Ali | 462 | |||
| Conservative | Kwasi Kwarteng | 461 | |||
| Turnout | 8,064 | 38 | +13 | ||
| Liberal Democrat hold | Swing | ||||
| Liberal Democrat gain from Labour | Swing | ||||
| Liberal Democrat gain from Labour | Swing | ||||
| Party | Candidate | Votes | % | ± | |
|---|---|---|---|---|---|
| Conservative | Kanta Mistry | 2,169 | |||
| Conservative | Robert Dunwell | 2,014 | |||
| Conservative | Atiq Malik | 1,997 | |||
| Labour | Rameshchandra Patel | 1,568 | |||
| Labour | Bill Dromey | 1,551 | |||
| Labour | Sandra Kabir | 1,516 | |||
| Liberal Democrat | John Lewis | 426 | |||
| Liberal Democrat | Frank Raisin | 369 | |||
| Green | Charles Bennett | 284 | |||
| Liberal Democrat | Anthony Spitzel | 276 | |||
| Turnout | 12,170 | 45 | +9 | ||
| Conservative gain from Labour | Swing | ||||
| Conservative gain from Labour | Swing | ||||
| Conservative gain from Labour | Swing | ||||
| Party | Candidate | Votes | % | ± | |
|---|---|---|---|---|---|
| Labour | Ann John | 1,644 | |||
| Labour | Dorman Long | 1,523 | |||
| Labour | Colum Moloney | 1,510 | |||
| Conservative | Ratna Kamdar | 607 | |||
| Conservative | Harji Dobasia | 591 | |||
| Conservative | Latlji Ladwa | 518 | |||
| Liberal Democrat | Karen Brown | 464 | |||
| Liberal Democrat | Diana Lewis | 372 | |||
| Liberal Democrat | Mohammed Khan | 306 | |||
| Green | Robert Davis | 216 | |||
| Independent | Francis Downes | 143 | |||
| Turnout | 7,894 | 28 | +4 | ||
| Labour hold | Swing | ||||
| Labour hold | Swing | ||||
| Labour hold | Swing | ||||
| Party | Candidate | Votes | % | ± | |
|---|---|---|---|---|---|
| Liberal Democrat | Paul Lorber | 1,600 | |||
| Liberal Democrat | Chandubhai Patel | 1,528 | |||
| Liberal Democrat | Robert Wharton | 1,327 | |||
| Labour | Wilhelmina Murray | 1,079 | |||
| Labour | Mohammad Ahrar-ul Hodo | 1,074 | |||
| Labour | Kanapathipillai Naheerathan | 1,032 | |||
| Conservative | Milan Kamdar | 756 | |||
| Conservative | Narendra Kotecha | 744 | |||
| Conservative | Patrick Garten | 737 | |||
| Green | Benjamin Vanstone | 211 | |||
| Turnout | 10,088 | 39 | +1 | ||
| Liberal Democrat hold | Swing | ||||
| Liberal Democrat hold | Swing | ||||
| Liberal Democrat hold | Swing | ||||
| Party | Candidate | Votes | % | ± | |
|---|---|---|---|---|---|
| Labour | Muhammed Butt | 1,292 | |||
| Liberal Democrat | Peter Corcoran | 1,287 | |||
| Labour | Joyce Bacchus | 1,259 | |||
| Conservative | Nicola Blackman | 1,247 | |||
| Labour | Jan Etienne | 1,209 | |||
| Liberal Democrat | Fabiola Marini | 1,184 | |||
| Conservative | Bhikubhai Patel | 1,146 | |||
| Liberal Democrat | Uday Pandya | 1,113 | |||
| Conservative | Miranda Colwill | 1,063 | |||
| Green | David Powell | 169 | |||
| Turnout | 10,969 | 47 | +13 | ||
| Labour gain from Conservative | Swing | ||||
| Liberal Democrat gain from Conservative | Swing | ||||
| Labour gain from Conservative | Swing | ||||
| Party | Candidate | Votes | % | ± | |
|---|---|---|---|---|---|
| Labour | Mary Farrell | 1,598 | |||
| Labour | Harbhajan Singh | 1,500 | |||
| Labour | Francis Eniola | 1,494 | |||
| Conservative | Nigel Fletcher | 1,137 | |||
| Conservative | Dineshkumar Mistry | 1,116 | |||
| Conservative | Richard Lacey | 1,090 | |||
| Liberal Democrat | Diana Ayres | 537 | |||
| Liberal Democrat | Freda Raingold | 427 | |||
| Liberal Democrat | Ulla Thiessen | 345 | |||
| Green | Ruth Breznay | 268 | |||
| Turnout | 9,512 | 40 | +6 | ||
| Labour hold | Swing | ||||
| Labour hold | Swing | ||||
| Labour hold | Swing | ||||
| Party | Candidate | Votes | % | ± | |
|---|---|---|---|---|---|
| Liberal Democrat | Vijaykumar Singh | 1,824 | |||
| Liberal Democrat | Valerie Brown | 1,730 | |||
| Liberal Democrat | Daniel Bessong | 1,709 | |||
| Labour | Dhirajlal Kataria | 1,619 | |||
| Labour | Navaratnam Paramakumaran | 1,443 | |||
| Labour | Zaffar Van Kalwala | 1,420 | |||
| Conservative | Arun Bhundia | 480 | |||
| Conservative | Shaheen Butt | 458 | |||
| Conservative | Michael Marklew | 383 | |||
| Green | Harem Jaff | 185 | |||
| Turnout | 11,251 | 46 | +6 | ||
| Liberal Democrat hold | Swing | ||||
| Liberal Democrat hold | Swing | ||||
| Liberal Democrat hold | Swing | ||||
| Party | Candidate | Votes | % | ± | |
|---|---|---|---|---|---|
| Liberal Democrat | Gavin Sneddon | 1,206 | |||
| Liberal Democrat | Mohammad Anwar | 1,178 | |||
| Labour | Lesley Jones | 1,108 | |||
| Liberal Democrat | Afifa Pervez | 1,080 | |||
| Labour | Gabrielle Kagan | 992 | |||
| Labour | Ahmad Shahzad | 977 | |||
| Green | Simone Aspis | 396 | |||
| Conservative | Sylvia Drab | 234 | |||
| Conservative | Brian Simmonds | 233 | |||
| Conservative | Claire Jakobsson | 231 | |||
| Turnout | 7,635 | 33 | +11 | ||
| Liberal Democrat gain from Labour | Swing | ||||
| Liberal Democrat gain from Labour | Swing | ||||
| Labour hold | Swing | ||||
References
- 1 2 "Local elections: Brent". BBC News Online. 5 May 2006. Retrieved 7 February 2015.
- ↑ King, Lorraine (10 June 2013). "Brent Liberal Democrat councillor defects to the Conservative Party". Brent & Kilburn Times. Retrieved 10 February 2015.
- ↑ Crerar, Pippa (12 April 2006). "Election blow to Labour as councillor joins Lib-Dems". London Evening Standard. NewsBank.
- ↑ "Lib Dems seize Brent East victory". BBC News Online. 19 September 2003. Retrieved 10 February 2015.
- ↑ "Result: Brent East". BBC News Online. 6 May 2005. Retrieved 10 February 2015.
- 1 2 "Labour slaughtered in London". Greater London, Kent, and Surrey Counties Publications. NewsBank. 5 May 2006.
- ↑ Anand, Sukhi (5 May 2006). "'A lot of hardworking councillors on both sides have been kicked out'". Greater London, Kent, and Surrey Counties Publications. NewsBank.
- ↑ Brown, Colin (6 May 2006). "Conservatives celebrate 'step forward'". The Independent. NewsBank. p. 7.
- ↑ Lydall, Ross (30 June 2006). "Wembley forced out of supercasino race". London Evening Standard. NewsBank.
- ↑ "UK local election results". Financial Times. NewsBank. 5 May 2006.
- 1 2 3 4 5 6 7 8 9 10 11 12 13 14 15 16 17 18 19 20 21 22 "Election results by wards". Brent Council. Retrieved 7 February 2015.