Sutton London Borough Council election, 2014
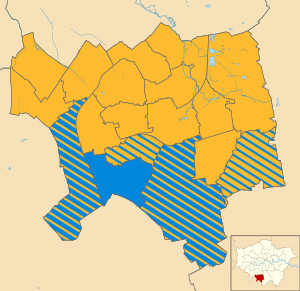
Map of the results of the 2014 Sutton council election. Conservatives in blue and Liberal Democrats in yellow.
The 2014 Sutton Council election took place on 22 May 2014 to elect members of Sutton Council in England.[1] This was on the same day as other local elections.
Results
The Liberal Democrats retained control winning 45 seats (+2) with the Conservatives winning 9 seats (−2).[1]
| Sutton Local Election Result 2014[2] | ||||||||||
|---|---|---|---|---|---|---|---|---|---|---|
| Party | Seats | Gains | Losses | Net gain/loss | Seats % | Votes % | Votes | +/− | ||
| Liberal Democrat | 45 | |
|
|
83 | 43 | ||||
| Conservative | 9 | |
|
|
17 | 30 | ||||
| Labour | 0 | |
|
|
0 | 15 | ||||
| UKIP | 0 | |
|
|
0 | 8 | ||||
| Green | 0 | |
|
|
0 | 3 | ||||
| Keep Our St. Helier Hospital Party | 0 | |
|
|
0 | <1 | ||||
| TUSC | 0 | |
|
|
0 | <1 | ||||
| Independent | 0 | |
|
|
0 | <1 | ||||
| English Democrat | 0 | |
|
|
0 | <1 | ||||
| Christian Peoples | 0 | |
|
|
0 | <1 | ||||
Ward results
Beddington North
| Party | Candidate | Votes | % | ± | |
|---|---|---|---|---|---|
| Liberal Democrat | Pat Ali | 1,299 | |||
| Liberal Democrat | Nick Mattey | 1,290 | |||
| Liberal Democrat | Nighat Piracha | 1,048 | |||
| UKIP | Leslie Price | 779 | |||
| Conservative | Hilary Wortley | 776 | |||
| Conservative | Anusha Vamadeva | 705 | |||
| Conservative | Leon Emirali | 673 | |||
| Labour | Sarah Gwynn | 654 | |||
| Labour | Margaret Hughes | 600 | |||
| Labour | Nawaz Ahmad | 570 | |||
| Green | Joan Hartfield | 257 | |||
| Green | Frederick Hartfield | 235 | |||
| Turnout | 3,372 | 42.4 | −28.8 | ||
| Liberal Democrat hold | Swing | ||||
| Liberal Democrat hold | Swing | ||||
| Liberal Democrat hold | Swing | ||||
Beddington South
| Party | Candidate | Votes | % | ± | |
|---|---|---|---|---|---|
| Liberal Democrat | Ed Joyce | 1,215 | |||
| Conservative | Neil Garratt | 1,120 | |||
| Liberal Democrat | Manuel Abellan | 1,079 | |||
| Conservative | Jim Simms | 1,045 | |||
| Liberal Democrat | Abdullah Okuyucu | 982 | |||
| Conservative | Andy Williams | 949 | |||
| UKIP | Bill Main-Ian | 788 | |||
| Labour | Mary Towler | 464 | |||
| Labour | Patrick Sim | 440 | |||
| Labour | Alfred Thomas | 430 | |||
| Turnout | 3,325 | 40.9 | −26.0 | ||
| Liberal Democrat hold | Swing | ||||
| Conservative hold | Swing | ||||
| Liberal Democrat hold | Swing | ||||
Belmont
| Party | Candidate | Votes | % | ± | |
|---|---|---|---|---|---|
| Conservative | David Hicks | 1,687 | |||
| Conservative | Patrick McManus | 1,534 | |||
| Conservative | Jane Pascoe | 1,389 | |||
| Liberal Democrat | Barbara McIntosh | 881 | |||
| Liberal Democrat | Cherry Mattey | 809 | |||
| Liberal Democrat | Russell Neale | 738 | |||
| UKIP | Adrian Noble | 653 | |||
| Labour | Gale Blears | 432 | |||
| Labour | Stephen Blears | 406 | |||
| Labour | Marian Wingrove | 376 | |||
| Turnout | 3,351 | 42.8 | −32.0 | ||
| Conservative hold | Swing | ||||
| Conservative hold | Swing | ||||
| Conservative hold | Swing | ||||
Carshalton Central
| Party | Candidate | Votes | % | ± | |
|---|---|---|---|---|---|
| Liberal Democrat | Hamish Pollock | 1,634 | |||
| Liberal Democrat | Alan Salter | 1,469 | |||
| Liberal Democrat | Jill Whitehead | 1,460 | |||
| Conservative | Simon Higgs | 1,077 | |||
| Conservative | Arthur Spirling | 989 | |||
| Conservative | Penny Spirling | 974 | |||
| UKIP | Michael Norman | 671 | |||
| Labour | Michael Cawley | 393 | |||
| Labour | Margaret Onians | 384 | |||
| Labour | Alan Tate | 351 | |||
| Green | Bob Steel | 324 | |||
| Green | Andrew Lindsay | 309 | |||
| Green | Mandi Suheimat | 205 | |||
| Christian Peoples | Ashley Dickenson | 90 | |||
| TUSC | Allan Matusevics | 74 | |||
| Turnout | 3,866 | 48.5 | −26.6 | ||
| Liberal Democrat hold | Swing | ||||
| Liberal Democrat hold | Swing | ||||
| Liberal Democrat hold | Swing | ||||
Carshalton South & Clockhouse
| Party | Candidate | Votes | % | ± | |
|---|---|---|---|---|---|
| Conservative | Tim Crowley | 1,449 | |||
| Conservative | Moira Butt | 1,365 | |||
| Liberal Democrat | Amy Haldane | 1,276 | |||
| Liberal Democrat | Peter Fosdike | 1,268 | |||
| Conservative | Tony Smith | 1,155 | |||
| Liberal Democrat | Alex Vicente-Machado | 1,100 | |||
| UKIP | Alexandra Wraith | 617 | |||
| Green | Ross Hemingway | 488 | |||
| Labour | Marilynne Burbage | 366 | |||
| Labour | David Davis | 331 | |||
| Labour | Claire Shearer | 259 | |||
| Green | Brian Dougherty | 245 | |||
| Turnout | 3,630 | 47.2 | −28.8 | ||
| Conservative hold | Swing | ||||
| Conservative hold | Swing | ||||
| Liberal Democrat hold | Swing | ||||
Cheam
| Party | Candidate | Votes | % | ± | |
|---|---|---|---|---|---|
| Liberal Democrat | Mary Burstow | 1,761 | |||
| Conservative | Holly Ramsey | 1,688 | |||
| Conservative | Graham Whitham | 1,495 | |||
| Liberal Democrat | Abigail Lock | 1,273 | |||
| Conservative | Misdaq Zaidi | 1,205 | |||
| Liberal Democrat | Simon Youlton | 1,156 | |||
| UKIP | Steve Carpenter | 595 | |||
| UKIP | Gus Dalgleish | 569 | |||
| Keep Our St Helier Hospital Party | David Ash | 396 | |||
| Labour | Alan Aylward | 244 | |||
| Labour | Laura Herridge | 236 | |||
| Labour | Lyndon Edwards | 207 | |||
| Turnout | 3,934 | 48.6 | −27.8 | ||
| Liberal Democrat hold | Swing | ||||
| Conservative hold | Swing | ||||
| Conservative hold | Swing | ||||
Nonsuch
| Party | Candidate | Votes | % | ± | |
|---|---|---|---|---|---|
| Liberal Democrat | Samantha Bourne | 1,744 | |||
| Liberal Democrat | Richard Broadbent | 1,570 | |||
| Liberal Democrat | Daniel Sangster | 1,431 | |||
| Conservative | Eric Allen | 1,361 | |||
| Conservative | Alan Plant | 1,291 | |||
| Conservative | Rona Forzani | 1,226 | |||
| UKIP | Howard Cowley | 901 | |||
| Labour | Laura Mullaney | 408 | |||
| Labour | Marcus Papadopoulos | 330 | |||
| Labour | Shawn Buck | 311 | |||
| Turnout | 4,057 | 48.8 | −25.3 | ||
| Liberal Democrat hold | Swing | ||||
| Liberal Democrat hold | Swing | ||||
| Liberal Democrat gain from Conservative | Swing | ||||
St. Helier
| Party | Candidate | Votes | % | ± | |
|---|---|---|---|---|---|
| Liberal Democrat | Jean Crossby | 1,195 | |||
| Liberal Democrat | Martin Gonzalez | 1,070 | |||
| Liberal Democrat | Doug Hunt | 1,069 | |||
| UKIP | Michael Lyon | 843 | |||
| Labour | Nicola Rosenbaum | 734 | |||
| Labour | John Keys | 685 | |||
| Labour | Andrew Theobald | 637 | |||
| Conservative | Lottie Crowley | 380 | |||
| Conservative | Alan Oliver | 320 | |||
| Conservative | Alison Huneke | 306 | |||
| Turnout | 2,910 | 34.7 | −23.4 | ||
| Liberal Democrat hold | Swing | ||||
| Liberal Democrat hold | Swing | ||||
| Liberal Democrat hold | Swing | ||||
Stonecot
| Party | Candidate | Votes | % | ± | |
|---|---|---|---|---|---|
| Liberal Democrat | Adrian Davey | 1,440 | |||
| Liberal Democrat | Nick Emmerson | 1,341 | |||
| Liberal Democrat | Miguel Javelot | 1,205 | |||
| Conservative | Malcolm Brown | 958 | |||
| Conservative | Graham Jarvis | 953 | |||
| UKIP | Lorraine Crawley | 886 | |||
| Conservative | Sheena Munsami | 691 | |||
| Labour | Victoria Barlow | 482 | |||
| Labour | Tessa Cornell | 395 | |||
| Labour | Bill Lang | 380 | |||
| Green | David Booth | 311 | |||
| TUSC | Livvy Najman | 74 | |||
| Turnout | 3,458 | 42.0 | −29.3 | ||
| Liberal Democrat hold | Swing | ||||
| Liberal Democrat hold | Swing | ||||
| Liberal Democrat hold | Swing | ||||
Sutton Central
| Party | Candidate | Votes | % | ± | |
|---|---|---|---|---|---|
| Liberal Democrat | David Bartolucci | 1,480 | |||
| Liberal Democrat | Vicent Galligan | 1,365 | |||
| Liberal Democrat | Ali Mirhashem | 1,192 | |||
| Labour | Emily Brothers | 662 | |||
| UKIP | Jake Grogan | 584 | |||
| Conservative | Charles Cornwell | 563 | |||
| Labour | Charles Mansell | 550 | |||
| Labour | Vic Paulino | 480 | |||
| Conservative | Nigel Cornwell | 463 | |||
| Conservative | Marie Grant | 412 | |||
| Green | Simon Honey | 369 | |||
| TUSC | Pauline Gorman | 90 | |||
| Turnout | 3,164 | 38.5 | −26.2 | ||
| Liberal Democrat hold | Swing | ||||
| Liberal Democrat hold | Swing | ||||
| Liberal Democrat hold | Swing | ||||
Sutton North
| Party | Candidate | Votes | % | ± | |
|---|---|---|---|---|---|
| Liberal Democrat | Ruth Dombey | 1,658 | |||
| Liberal Democrat | Marlene Heron | 1,539 | |||
| Liberal Democrat | Stephen Penneck | 1,410 | |||
| UKIP | Stewart Wood | 781 | |||
| Conservative | Alec Beeson | 742 | |||
| Conservative | Millie Shields | 659 | |||
| Conservative | Mukesh Rao | 516 | |||
| Labour | Kathy Allen | 502 | |||
| Labour | Ann Morrison | 420 | |||
| Labour | Dawn Lever | 416 | |||
| Turnout | 3,345 | 42.6 | −26.9 | ||
| Liberal Democrat hold | Swing | ||||
| Liberal Democrat hold | Swing | ||||
| Liberal Democrat hold | Swing | ||||
Sutton South
| Party | Candidate | Votes | % | ± | |
|---|---|---|---|---|---|
| Liberal Democrat | Richard Clifton | 1,380 | |||
| Liberal Democrat | Trish Fivey | 1,296 | |||
| Conservative | Tony Shields | 1,197 | |||
| Conservative | Jason Hughes | 1,089 | |||
| Conservative | Heather Howell | 1,075 | |||
| Liberal Democrat | John Phillips | 1,040 | |||
| UKIP | Jerry Wraith | 418 | |||
| Keep Our St Helier Hospital Party | Tiz North | 372 | |||
| Labour | Kathryn Brennan | 371 | |||
| Labour | Ronald Phillips | 307 | |||
| Labour | Patricia Simons | 302 | |||
| TUSC | Steve Appleton | 108 | |||
| Turnout | 3,297 | 43.2 | −25.8 | ||
| Liberal Democrat hold | Swing | ||||
| Liberal Democrat hold | Swing | ||||
| Conservative hold | Swing | ||||
Sutton West
| Party | Candidate | Votes | % | ± | |
|---|---|---|---|---|---|
| Liberal Democrat | Kevin Burke | 1,648 | |||
| Liberal Democrat | Wendy Mathys | 1,477 | |||
| Liberal Democrat | Simon Wales | 1,424 | |||
| Conservative | Richard Butt | 836 | |||
| Conservative | Mary Edwards | 815 | |||
| Conservative | Jonathan Pritchard | 712 | |||
| UKIP | Glen Roberts | 540 | |||
| Labour | Andy Cook | 501 | |||
| Labour | Maria Ponto | 448 | |||
| Labour | Margaret Sinclair | 406 | |||
| Keep Our St Helier Hospital Party | Frances Cornford | 358 | |||
| Turnout | 3,447 | 42.0 | −28.5 | ||
| Liberal Democrat hold | Swing | ||||
| Liberal Democrat hold | Swing | ||||
| Liberal Democrat hold | Swing | ||||
The Wrythe
| Party | Candidate | Votes | % | ± | |
|---|---|---|---|---|---|
| Liberal Democrat | Callum Morton | 1,341 | |||
| Liberal Democrat | Colin Stears | 1,337 | |||
| Liberal Democrat | Naliben Patel | 1,199 | |||
| UKIP | Chris Howe | 754 | |||
| Conservative | Benjamin Scully | 513 | |||
| Conservative | Charles Manton | 487 | |||
| Labour | Deirdre Barry | 455 | |||
| Labour | Alex Milligan | 415 | |||
| Conservative | Marion Williams | 378 | |||
| Labour | Tony Thorpe | 365 | |||
| Green | Derek Coleman | 303 | |||
| Turnout | 3,136 | 40.1 | −26.7 | ||
| Liberal Democrat hold | Swing | ||||
| Liberal Democrat hold | Swing | ||||
| Liberal Democrat hold | Swing | ||||
Wallington North
| Party | Candidate | Votes | % | ± | |
|---|---|---|---|---|---|
| Liberal Democrat | Sunita Gordon | 1,363 | |||
| Liberal Democrat | Joyce Melican | 1,317 | |||
| Liberal Democrat | Marian Radford | 1,247 | |||
| Conservative | Elliot Colburn | 1,033 | |||
| Conservative | James McDermott-Hill | 865 | |||
| UKIP | Carole Lander | 823 | |||
| Conservative | Omonlyl Giwa | 737 | |||
| Labour | Victoria Rosenbaum | 470 | |||
| Labour | Richard Smith | 447 | |||
| Labour | Peter Turner | 415 | |||
| Green | Jim Duffy | 341 | |||
| Green | Penny Mouncey | 280 | |||
| Green | Phil Mouncey | 205 | |||
| Turnout | 3,696 | 44.0 | −27.0 | ||
| Liberal Democrat hold | Swing | ||||
| Liberal Democrat hold | Swing | ||||
| Liberal Democrat hold | Swing | ||||
Wallington South
| Party | Candidate | Votes | % | ± | |
|---|---|---|---|---|---|
| Liberal Democrat | Colin Hall | 1,593 | |||
| Liberal Democrat | Jayne McCoy | 1,558 | |||
| Liberal Democrat | Muhammad Sadiq | 1,221 | |||
| Conservative | Steven Ayres | 825 | |||
| UKIP | Marion Houghton | 694 | |||
| Conservative | Christopher Wortley | 649 | |||
| Conservative | Stephen Odunton | 571 | |||
| Keep Our St Helier Hospital Party | David Murray | 377 | |||
| Labour | David Towler | 374 | |||
| Labour | Susan Theobald | 358 | |||
| Green | Maeve Tomlinson | 301 | |||
| Labour | Jas Weir | 283 | |||
| Green | Rosa Rajendran | 274 | |||
| English Democrat | David Jeffreys | 110 | |||
| Turnout | 3,455 | 43.1 | −27.7 | ||
| Liberal Democrat hold | Swing | ||||
| Liberal Democrat hold | Swing | ||||
| Liberal Democrat hold | Swing | ||||
Wandle Valley
| Party | Candidate | Votes | % | ± | |
|---|---|---|---|---|---|
| Liberal Democrat | Margaret Court | 1,156 | |||
| Liberal Democrat | Hanna Zuchowska | 929 | |||
| Liberal Democrat | Jason Reynolds | 891 | |||
| UKIP | Graham Murray | 867 | |||
| Labour | Stephen McGrane | 705 | |||
| Labour | Bonnie Craven | 697 | |||
| Labour | Michael Craven | 633 | |||
| Conservative | James England | 436 | |||
| Green | Stephen Hart | 380 | |||
| Conservative | Jonathan Downer | 333 | |||
| Conservative | Peter Wootten | 314 | |||
| Turnout | 2,943 | 35.0 | −25.1 | ||
| Liberal Democrat hold | Swing | ||||
| Liberal Democrat hold | Swing | ||||
| Liberal Democrat hold | Swing | ||||
Worcester Park
| Party | Candidate | Votes | % | ± | |
|---|---|---|---|---|---|
| Liberal Democrat | Arthur Hookway | 1,508 | |||
| Liberal Democrat | Richard Marston | 1,455 | |||
| Liberal Democrat | Paul Wingfield | 1,300 | |||
| Conservative | Stuart Mackay | 1,264 | |||
| Conservative | Simon Densley | 1,226 | |||
| Conservative | Gino Marotta | 1,146 | |||
| UKIP | Han-Ley Tang | 768 | |||
| Labour | John Evers | 474 | |||
| Labour | Hilary Hosking | 462 | |||
| Labour | David Hosking | 421 | |||
| Independent | Richard Edmonds | 185 | |||
| Turnout | 3,950 | 43.7 | −27.9 | ||
| Liberal Democrat hold | Swing | ||||
| Liberal Democrat hold | Swing | ||||
| Liberal Democrat gain from Conservative | Swing | ||||
References
- 1 2 "England council results". BBC News. Retrieved 23 May 2014.
- ↑ "London Borough of Sutton Council Election 2014 - Thursday, 22nd May, 2014". Sutton.gov.uk. London Borough of Sutton Council. Retrieved 3 August 2016.
- 1 2 3 4 5 6 7 8 9 10 11 12 13 14 15 16 17 18 Piggott, Gareth (September 2014). London Borough Council Elections 22 May 2014 (PDF). London: Greater London Authority. pp. 163–168, 220–221. ISSN 1479-7879. Retrieved 1 August 2016.
This article is issued from Wikipedia - version of the 9/1/2016. The text is available under the Creative Commons Attribution/Share Alike but additional terms may apply for the media files.