Canadian federal election, 1908
| | |||||||||||||||||||||||||||||||||||||||||||||||
| |||||||||||||||||||||||||||||||||||||||||||||||
| |||||||||||||||||||||||||||||||||||||||||||||||
|
| |||||||||||||||||||||||||||||||||||||||||||||||
| |||||||||||||||||||||||||||||||||||||||||||||||
The Canadian federal election of 1908 was held on October 26 to elect members of the Canadian House of Commons of the 11th Parliament of Canada. Prime Minister Sir Wilfrid Laurier's Liberal Party of Canada was re-elected for a fourth consecutive term in government with a majority government. The Liberals lost four seats and a small share of the popular vote.
Sir Robert Borden's Conservatives and Liberal-Conservatives won ten additional seats.
The voter turnout was 70.3%.[1]
National results
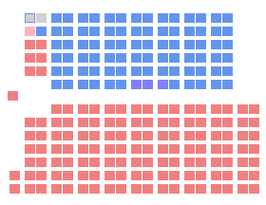
The Canadian parliament after the 1908 election
| ↓ | ||||
| 133 | 85 | 3 | ||
| Liberal | Conservative | O | ||
| Party | Party leader | # of candidates |
Seats | Popular vote | |||||
|---|---|---|---|---|---|---|---|---|---|
| 1904 | Elected | Change | # | % | Change | ||||
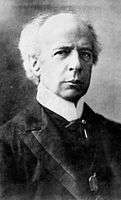
| Liberal | Wilfrid Laurier | 213 | 137 | 133 | -2.9% | 570,311 | 48.87% | -2.01pp | |
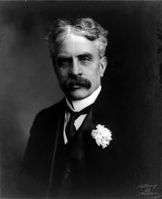
| Conservative | Robert Borden | 207 | 70 | 82 | +17.1% | 524,641 | 44.95% | +0.55pp | |
| Liberal-Conservative | 4 | 5 | 3 | -40.0% | 14,733 | 1.26% | -0.27pp | ||
| Independent | 15 | 1 | 1 | - | 16,903 | 1.45% | +0.45pp | ||
| Labour | 3 | - | 1 | 10,400 | 0.89% | +0.68pp | |||
| Unknown | 7 | - | - | - | 13,478 | 1.15% | +0.02pp | ||
| Socialist | 5 | - | - | - | 6,071 | 0.52% | +0.35pp | ||
| Independent Conservative | 2 | 1 | 1 | -100% | 5,314 | 0.46% | -0.04pp | ||
| Independent Liberal | 5 | - | - | - | 5,191 | 0.44% | +0.41pp | ||
| Total | 461 | 214 | 221 | +2.8% | 1,167,042 | 100% | |||
| Sources: http://www.elections.ca -- History of Federal Ridings since 1867 | |||||||||
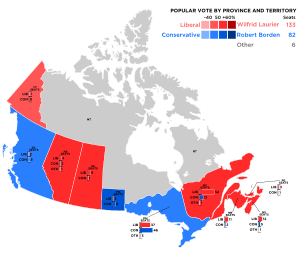
Results by province
| Party | BC | AB | SK | MB | ON | QC | NB | NS | PE | YK | Total | ||
|---|---|---|---|---|---|---|---|---|---|---|---|---|---|
| Liberal | Seats: | 2 | 4 | 9 | 2 | 37 | 52 | 11 | 12 | 3 | 1 | 133 | |
| Popular vote (%): | 35.9 | 50.2 | 56.6 | 45.4 | 45.0 | 53.0 | 56.2 | 51.0 | 50.4 | 40.2 | 48.9 | ||
| Conservative | Seats: | 5 | 2 | 1 | 8 | 46 | 12 | 2 | 5 | 1 | - | 82 | |
| Vote (%): | 46.8 | 38.1 | 36.8 | 51.5 | 49.2 | 39.5 | 43.8 | 44.5 | 49.6 | 10.8 | 45.0 | ||
| Liberal-Conservative | Seats: | 1 | 1 | 1 | 3 | ||||||||
| Vote (%): | 6.4 | 1.5 | 4.5 | 1.3 | |||||||||
| Independent | Seats: | - | - | - | - | 1 | - | 1 | |||||
| Vote (%): | 8.9 | 3.7 | 0.6 | 0.1 | 1.8 | 1.1 | 1.5 | ||||||
| Labour | Seats: | - | 1 | 1 | |||||||||
| Vote (%): | 0.7 | 2.6 | 0.9 | ||||||||||
| Independent Conservative | Seats: | - | 1 | 1 | |||||||||
| Vote (%): | 5.9 | 0.4 | 0.5 | ||||||||||
| Total seats | 7 | 7 | 10 | 10 | 86 | 65 | 13 | 18 | 4 | 1 | 221 | ||
| Parties that won no seats: | |||||||||||||
| Unknown | Vote (%): | 1.3 | 1.4 | 1.9 | 49.0 | 1.2 | |||||||
| Socialist | Vote (%): | 7.1 | 1.6 | 2.9 | 0.2 | 0.5 | |||||||
| Independent Liberal | Vote (%): | 0.1 | 1.8 | 0.4 | |||||||||
Vote and seat summaries
See also
- List of Canadian federal general elections
- List of political parties in Canada
- 11th Canadian Parliament
References
This article is issued from Wikipedia - version of the 11/17/2016. The text is available under the Creative Commons Attribution/Share Alike but additional terms may apply for the media files.