Canadian federal election, 1958
| | |||||||||||||||||||||||||||||||||||||||||||||||||||||||||||||||||||||||||||||||||||||||||||
| |||||||||||||||||||||||||||||||||||||||||||||||||||||||||||||||||||||||||||||||||||||||||||
| |||||||||||||||||||||||||||||||||||||||||||||||||||||||||||||||||||||||||||||||||||||||||||
|
| |||||||||||||||||||||||||||||||||||||||||||||||||||||||||||||||||||||||||||||||||||||||||||
| |||||||||||||||||||||||||||||||||||||||||||||||||||||||||||||||||||||||||||||||||||||||||||
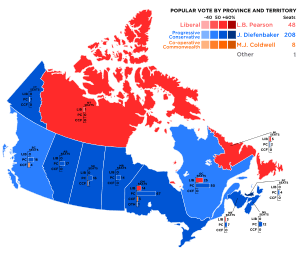
The Canadian federal election of 1958 was the 24th general election in Canada's history. It was held to elect members of the Canadian House of Commons of the 24th Parliament of Canada on March 31, 1958, just nine months after the 23rd election. It transformed Prime Minister John Diefenbaker's minority into the then-largest majority government (by percentage of seats) in Canadian history and the second largest percentage of the popular vote. The turnout was 79.4%. [1]
Overview

Diefenbaker called a snap election and capitalized on three factors:
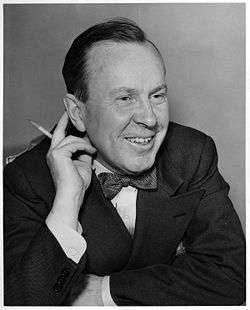
- Nationally, the Liberals had just chosen a new leader, Lester Pearson, who had given an ill-advised maiden speech in Commons that asked Diefenbaker to resign and recommend the Governor General allow the Liberals to form a government without an election due to the recent economic downturn. Diefenbaker seized on the remark by describing a series of classified Liberal Cabinet documents stating that the economy would face a downturn in that year. This contrasted heavily with the Liberals' 1957 campaign promises.
- A turnaround in Quebec: Quebec had been largely Liberal since the Conscription Crisis of 1917, but upon the resignation of former Prime Minister Louis St. Laurent, the province had no favourite son leader, as they had since 1948, and its voters were open to new options. Seeking a greater voice in Ottawa, Quebec Premier Maurice Duplessis's Union Nationale used their party machine to ally with the Tories, allowing Diefenbaker's Progressive Conservatives to sweep what had been a Liberal stronghold for a generation.
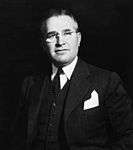
- A collapse in support for the Social Credit Party which lost all 19 of its seats. Prior to the 1957 election, the Socreds were seen as a credible threat to replace the Tories as the main right wing party in the country, as they had done in British Columbia and Alberta, but the popularity of the Diefenbaker government persuaded many Social Credit supporters to abandon their party. This allowed the Tories to pick up not only Social Credit seats, but also proved decisive in many seats that featured a fractured vote between the PCs, Social Credit, Liberals, and CCF. Notably, the Tories swept all seventeen seats in Alberta, where they had previously held just three seats to Social Credit's thirteen. The election proved to be the start of a long decline for Social Credit. It would never seriously challenge the PCs dominance in the West again.
National results

| ↓ | ||||
| 208 | 48 | 8 | 1 | |
| Progressive Conservative | Liberal | CCF | O | |
| Party | Party leader | # of candidates |
Seats | Popular vote | |||||
|---|---|---|---|---|---|---|---|---|---|
| 1957 | Elected | % Change | # | % | pp Change | ||||
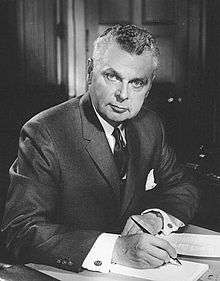
| Progressive Conservative | John Diefenbaker | 265 | 111 | 208 | +87.4% | 3,908,633 | 53.66% | +14.85 | |
| Liberal | Lester B. Pearson | 264 | 104 | 48 | -53.8% | 2,432,953 | 33.40% | -7.35 | |
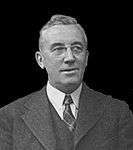
| Co-operative Commonwealth | M.J. Coldwell | 169 | 25 | 8 | -68.0% | 692,668 | 9.51% | -1.20 | |
| Liberal–Labour | 1 | 1 | 1 | 0% | 11,956 | 0.16% | - | ||
| Social Credit | Solon Low | 82 | 19 | - | -100% | 188,356 | 2.59% | -3.99 | |
| Independent | 9 | 2 | - | -100% | 14,211 | 0.20% | -0.87 | ||
| Independent Liberal | 10 | 2 | - | -100% | 12,054 | 0.17% | -1.25 | ||
| Labor–Progressive | Tim Buck | 18 | - | - | - | 9,769 | 0.13% | +0.02 | |
| Candidats des électeurs | Réal Caouette | 1 | - | - | - | 8,276 | 0.11% | -0.01 | |
| Independent PC | 5 | 1 | - | -100% | 2,097 | 0.03% | -0.19 | ||
| Socialist | 2 | * | - | * | 1,113 | 0.02% | * | ||
| Capital familial | H-G Grenier | 1 | * | - | * | 968 | 0.01% | * | |
| Radical chrétien | 1 | * | - | * | 687 | 0.01% | * | ||
| Independent SC | 1 | - | - | - | 361 | x | -0.04 | ||
| Ouvrier canadien | 1 | * | - | * | 243 | x | * | ||
| Independent Conservative | 1 | * | - | * | 122 | x | * | ||
| Total | 831 | 265 | 265 | - | 7,284,467 | 100.00% | |||
| Sources: http://www.elections.ca History of Federal Ridings since 1867 | |||||||||
Notes:
"Previous" refers to standings at previous election, not to standings in the House of Commons at dissolution.
* The party did not nominate candidates in the previous election.
x - less than 0.005% of the popular vote
Vote and seat summaries
Results by province
| Party name | BC | AB | SK | MB | ON | QC | NB | NS | PE | NL | YK | NW | Total | ||
|---|---|---|---|---|---|---|---|---|---|---|---|---|---|---|---|
| Progressive Conservative | Seats: | 18 | 17 | 16 | 14 | 67 | 50 | 7 | 12 | 4 | 2 | 1 | - | 208 | |
| Vote (%): | 49.4 | 59.9 | 51.4 | 56.7 | 56.4 | 49.6 | 54.1 | 57.0 | 62.2 | 45.2 | 54.5 | 42.8 | 53.7 | ||
| Liberal | Seats: | - | - | - | - | 14 | 25 | 3 | - | - | 5 | - | 1 | 48 | |
| Vote (%): | 16.1 | 13.7 | 19.6 | 21.6 | 32.1 | 45.6 | 43.4 | 38.4 | 37.5 | 54.4 | 43.3 | 57.2 | 33.4 | ||
| Co-operative Commonwealth | Seats: | 4 | - | 1 | - | 3 | - | - | - | - | - | 8 | |||
| Vote (%): | 24.5 | 4.4 | 28.4 | 19.6 | 10.5 | 2.3 | 1.8 | 4.5 | 0.3 | 0.2 | 9.5 | ||||
| Liberal-Labour | Seats: | 1 | 1 | ||||||||||||
| Vote (%): | 0.5 | 0.2 | |||||||||||||
| Total Seats | 22 | 17 | 17 | 14 | 85 | 75 | 10 | 12 | 4 | 7 | 1 | 1 | 265 | ||
| Parties that won no seats: | |||||||||||||||
| Social Credit | Vote (%): | 9.6 | 21.6 | 0.4 | 1.8 | 0.3 | 0.6 | 0.7 | 2.6 | ||||||
| Independent | Vote (%): | xx | xx | 0.1 | 0.6 | 0.2 | |||||||||
| Independent Liberal | Vote (%): | 0.6 | 0.2 | 0.2 | |||||||||||
| Labor–Progressive | Vote (%): | 0.4 | 0.3 | 0.1 | 0.4 | 0.1 | 0.1 | 0.1 | |||||||
| C. des électeurs | Vote (%): | 0.4 | 0.1 | ||||||||||||
| Independent PC | Vote (%): | 0.1 | 0.1 | xx | |||||||||||
| Socialist | Vote (%): | xx | xx | xx | |||||||||||
| Capitale familiale | Vote (%): | xx | xx | ||||||||||||
| Radical chrétien | Vote (%): | xx | xx | ||||||||||||
| Independent SC | Vote (%): | 0.1 | xx | ||||||||||||
| Ouvrier canadien | Vote (%): | xx | xx | ||||||||||||
| Ind. Conservative | Vote (%): | 2.3 | xx | ||||||||||||
xx - less than 0.05% of the popular vote
See also
- List of Canadian federal general elections
- List of political parties in Canada
- 24th Canadian Parliament
References
- ↑ Pomfret, R. "Voter Turnout at Federal Elections and Referendums". Elections Canada. Elections Canada. Retrieved 23 February 2014.
External links
- The Elections of 1957 and 1958, by P.E. Bryden
- Electoral Results by Party, on Parliament of Canada site