West German federal election, 1987
| | |||||||||||||||||||||||||||||||||||||||||||||||||||||||||||||||||||||||||||||||||||||
| |||||||||||||||||||||||||||||||||||||||||||||||||||||||||||||||||||||||||||||||||||||
| |||||||||||||||||||||||||||||||||||||||||||||||||||||||||||||||||||||||||||||||||||||
|
| |||||||||||||||||||||||||||||||||||||||||||||||||||||||||||||||||||||||||||||||||||||
| Party list election results by state: dark blue denotes states where CSU had the absolute majority of the votes; lighter blue denotes states where CDU had the plurality of votes; and pink denotes states where the SPD had the plurality of votes | |||||||||||||||||||||||||||||||||||||||||||||||||||||||||||||||||||||||||||||||||||||
| |||||||||||||||||||||||||||||||||||||||||||||||||||||||||||||||||||||||||||||||||||||
.jpg)


German federal elections took place on 25 January 1987, to elect members to the 11th Bundestag, the parliament of the Federal Republic of Germany. This was the last federal election held in West Germany prior to German reunification.
 |
| This article is part of a series on the politics and government of Germany |
|
Constitution ("Fundamental Law Code") |
|
| Foreign relations |
Issues and campaign
The SPD nominated Johannes Rau, their vice chairman and the Minister-President of North Rhine-Westphalia, as their candidate for Chancellor. However, the SPD suffered from internal divisions and competition with the Greens. It was also unclear as to how they would form a government, as the Greens were divided over whether to take part in governments.
One of the major issues in this election was the environment, after the Chernobyl disaster and other accidents.
Results
| Parties | Constituency | Party list | Total seats | |||||||||||||
|---|---|---|---|---|---|---|---|---|---|---|---|---|---|---|---|---|
| Votes | % | +/− | Seats | +/− | Votes | % | +/− | Seats | +/− | Seats† | +/− | % | ||||
| Social Democratic Party (SPD) | 14,787,953 | 39.2 | −1.2 | 79 | +11 | 14,025,763 | 37.0 | −1.2 | 107 | −18 | 193 | −9 | 37.2 | |||
| Christian Democratic Union (CDU) | 14,168,527 | 37.5 | −3.5 | 124 | −12 | 13,045,745 | 34.4 | −3.7 | 50 | −5 | 185 | −17 | 35.6 | |||
| Christian Social Union (CSU) | 3,859,244 | 10.2 | −0.9 | 45 | +1 | 3,715,827 | 9.8 | −0.8 | 4 | −5 | 49 | −4 | 9.4 | |||
| Free Democratic Party (FDP) | 1,760,496 | 4.7 | +1.9 | 0 | ±0 | 3,440,911 | 9.1 | +2.2 | 46 | +12 | 48 | +13 | 9.2 | |||
| The Greens‡ | 2,649,459 | 7.0 | +2.9 | 0 | ±0 | 3,126,256 | 8.3 | +2.7 | 42 | +15 | 44 | +16 | 8.5 | |||
| National Democratic Party (NPD) | 182,880 | 0.5 | +0.4 | 0 | ±0 | 227,054 | 0.6 | +0.4 | 0 | ±0 | 0 | ±0 | 0 | |||
| Ecological Democratic Party (ÖDP) | 40,765 | 0.1 | +0.1 | 0 | ±0 | 109,152 | 0.3 | +0.3 | 0 | ±0 | 0 | ±0 | 0 | |||
| The Women (FRAUEN) | – | – | – | – | – | 62,904 | 0.2 | +0.2 | 0 | ±0 | 0 | ±0 | 0 | |||
| Bavaria Party (BP) | 8,024 | 0.0 | +0.0 | 0 | ±0 | 26,367 | 0.1 | +0.1 | 0 | ±0 | 0 | ±0 | 0 | |||
| Responsible Citizens | 611 | 0.0 | +0.0 | 0 | ±0 | 24,630 | 0.1 | +0.1 | 0 | ±0 | 0 | ±0 | 0 | |||
| Patriots for Germany (Patrioten) | 27,352 | 0.1 | +0.1 | 0 | ±0 | 22,732 | 0.1 | +0.1 | 0 | ±0 | 0 | ±0 | 0 | |||
| Centre Party (ZENTRUM) | 4,020 | 0.0 | +0.0 | 0 | ±0 | 19,035 | 0.1 | +0.1 | 0 | ±0 | 0 | ±0 | 0 | |||
| Marxist–Leninist Party (MLPD) | 596 | 0.0 | +0.0 | 0 | ±0 | 13,422 | 0.0 | +0.0 | 0 | ±0 | 0 | ±0 | 0 | |||
| Christian Bavarian People's Party (CBV) | 741 | 0.0 | ±0 | 0 | ±0 | 5,282 | 0.0 | ±0 | 0 | ±0 | 0 | ±0 | 0 | |||
| All Social Insurants and Pensioners (ASD) | 3,151 | 0.0 | +0.0 | 0 | ±0 | 1,834 | 0.0 | +0.0 | 0 | ±0 | 0 | ±0 | 0 | |||
| Free German Workers' Party (FAP) | 349 | 0.0 | +0.0 | 0 | ±0 | 405 | 0.0 | +0.0 | 0 | ±0 | 0 | ±0 | 0 | |||
| Humanist Party (HP) | 788 | 0.0 | +0.0 | 0 | ±0 | – | – | – | – | – | 0 | ±0 | 0 | |||
| SOLIDARITÄT | 754 | 0.0 | +0.0 | 0 | ±0 | – | – | – | – | – | 0 | ±0 | 0 | |||
| Independent Workers' Party (UAP) | 352 | 0.0 | +0.0 | 0 | ±0 | – | – | – | – | – | 0 | ±0 | 0 | |||
| Family Party (Familie) | 130 | 0.0 | +0.0 | 0 | ±0 | – | – | – | – | – | 0 | ±0 | 0 | |||
| Free Social Union (FSU) | 110 | 0.0 | +0.0 | 0 | ±0 | – | – | – | – | – | 0 | ±0 | 0 | |||
| Electoral groups and independents | 246,511 | 0.7 | +0.6 | 0 | ±0 | – | – | – | – | – | 0 | ±0 | 0 | |||
| Invalid/blank votes | 482,481 | — | — | — | — | 357,975 | — | — | — | — | — | — | — | |||
| Totals | 38,225,294 | 100 | ±0.0 | 248 | ±0 | 38,225,294 | 100 | ±0.0 | 249 | –1 | 519 | −1 | ±0 | |||
| Registered voters/turnout | 45,327,982 | 84.3 | — | — | — | 45,327,982 | 84.3 | — | — | — | — | — | — | |||
| Source: Federal Returning Officer | ||||||||||||||||
- ^† — includes the non-voting delegates for West Berlin (11 CDU, 7 SPD, 2 FDP, 2 AL).
- ^‡ — known as Alternative Liste für Demokratie und Umweltschutz (AL) in West Berlin.
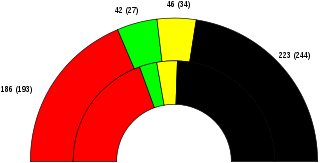
| 234 | 48 | 193 | 44 |
| CDU/CSU | FDP | SPD | Grüne |
Post-election
The coalition between the CDU/CSU and the FDP returned to government, with Helmut Kohl as Chancellor. The Greens came into parliament for the second time and seemed to be established on federal level.
References
- ↑ "Voter turnout by election year". Website of the Federal Returning Officer's Office. The Federal Returning Officer. Retrieved 7 November 2014.
Sources
| Parliamentary elections | |
|---|---|
| Presidential elections | |
| European elections | |
| Referendums | |
| |